

I like to write about the significance of various technical indicators and so today’s topic is the 200-Day Moving Average. 200 trading days is about 40 weeks of trading, and so the 200-Day MA encompasses the better part of the previous year of trading. For that reason, it is a good technical indicator of the long-term trend of a stock’s trading pattern.
Standard
The 200-Day MA is a standard technical indicator that you can easily find on any free stock charting service, such as stockcharts.com. In this chart of the S&P 500 Index ETF (SPY), the 200-Day MA is the red line that has a current value of $273.39 as highlighted:
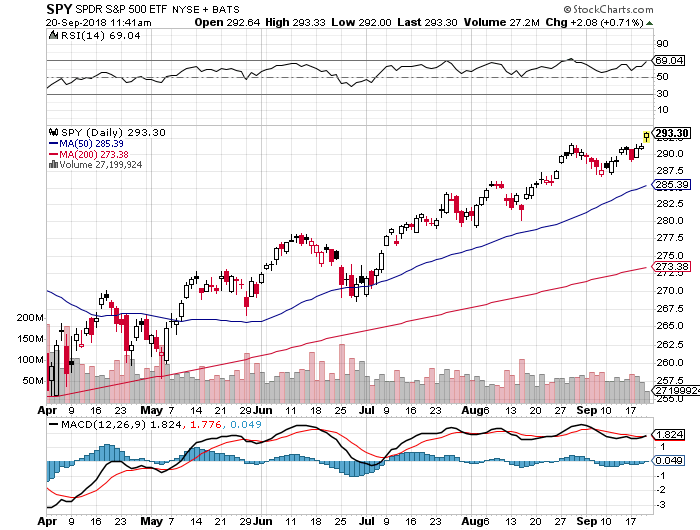
You can see that the 200-Day line is pretty constant and doesn’t have much variability, due to its having 200 data points. You can easily tell what the 200-Day MA is on this or on any stock chart.
Uses
Its main use is to see where the stock is currently trading in relation to the 200-Day MA. If the stock is trading above the 200-Day line, then the 200-Day line is likely to continue to move upward.
- The alarms go off, however, when the stock falls and threatens to fall below or actually does fall below the 200-Day line. This is likely a signal to Sell if you own a position in the stock, and a signal not to buy if you are just looking at it. It means institutional money is selling the stock, or that something has changed in the company or the sector or in the market in general such that the future is probably not rosy.
- Another bearish sign is if the 50-Day Moving Average line dips below the 200-Day MA line. This is called a “death cross” and could occur even if the current price of the stock is above the 200-Day line.
IMO
I sell long positions that dip below the 200-Day Moving average, if I haven’t already sold them. Don’t hold on to losing positions in the hope that they will rebound and you can recoup your money. You may recoup your money, but it may take a long time and at an opportunity cost of missing out on other positions that may outperform your losing position. The 200-Day MA can work as well for index ETF’s as it can for individual stock positions, perhaps even better because there is so much trading information inherent in an index ETF made up of that many individual positions. Just be aware of that stable red line on most free stock charting services and know what it means and how to use it.