Efficient Markets Hypothesis

The EMH

You are probably familiar with the Efficient Markets Hypothesis, but you may not be familiar with what it implies, and how it applies to the current market, regulated as it is.  Read on!

What is it?

The EMH contends that security pricing reflects all known information, which is obtained quickly and enables a company’s stock to adjust rapidly.  In addition, it is believed that the daily fluctuation in price is a result of a “random walk” pattern.  If so, any activist strategy is thought to add no value to the process.  The Bottom Line:  Investors are unable to outperform the market on a consistent basis over time, and passive or “indexing” investment strategy is favored.  Kudos to Dr. Eugene Fama, the “Father of the EMH”, and Dr. Burton Malkiel, an economist and author who developed the random walk notion.

The EMH has been “winning” in recent years as lots of money has flowed out of actively-traded mutual funds and into passively-managed ETF’s.  Morningstar reported the following for March 2017, just as an example:  “In March, investors put $31.1 billion into U.S. equity passive funds, up from $29.1 billion in February 2017. On the active side, investors pulled $18.6 billion out of U.S. equity funds during the month, as opposed to $8.9 billion in the previous month.”  The latest “fund of the month” concocted by the big brokerages are out of style, and Exchange Traded Funds (ETF’s) are in.  Fidelity, with a preponderance of managed funds, is “out”, and Vanguard, the forerunner of low fee indexed funds, is “in”.

There are 3 “forms” of the EMH, each with different ramifications.  The “strong” form posits that stock prices currently reflect all available information, whether public or private.  If the strong form were true, why is insider trading illegal, and why do investors go to jail because of insider trading?  Doug DeCinces, the Baltimore Orioles’ replacement for Hall of Famer Brooks Robinson, and a subsequent California Angel, was recently convicted of insider trading, so prosecutors are still alert to it.  Neither fundamental nor technical analysis are useful, which is also true for the “semi-strong” form of the EMH.   Fundamental analysis may be useful under the “weak” form EMH, but Technical analysis is not useful under any EMH form.  So, one can maybe reconcile the “weak” form EMH with the most famous practitioner of fundamental analysis, Warren Buffet.  But, candlestick charts, head and shoulders pattern, cup and handle, support and resistance, and all of the other vocabulary associated with technical analysis?  All worthless, according to any form of the Efficient Markets Hypothesis.  Therefore it’s better just to invest in the S&P 500 Index.

What does the EMH mean for you?

If you have an IRA or a 401k, and you have some of your account invested in, let’s say, a Large Cap Growth Fund with a 5 Star Morningstar Rating, you are thumbing your nose at the Efficient Markets Hypothesis.  Same with a Small Cap Value Fund, or with most funds managed by the major fund shops not named Vanguard – Fidelity, American Funds, Lord Abbett, and the like.  T. Rowe Price funds do a good job of stock picking – most of the big fund families have good stock picking managers.  But they are inherently not Efficient Market Hypothesis believers.  All of the big mutual funds are predicated on the basis that they can use fundamental or technical analysis to outperform the market index.  Instead, if you believe the EMH, you should be in an Index fund – that is, if your 401k plan administrator even offers one.  (A Large Cap fund is about the same thing, but not quite).  Moreover, you are paying more for lower returns – index funds tend to have much lower fees than do your standard Small Cap Value Fund.

How do you properly index-invest your portfolio and therefore abide by the EMH?  You can’t do it just by investing in the SPY – the S&P 500 Index ETF, although that could be one component of your indexed portfolio.  You need a domestic bond index fund, as well as international equity and bond index funds, all for asset class diversification.  The older you are, the more you should be in bonds.  In a recent podcast, Dr. William Sharpe, the developer of the Sharpe Ratio for measuring risk-adjusted return, and a firm EMH proponent, suggests one could adequately Index and Diversify by choosing 4 different Vanguard funds.  While Dr. Sharpe did not name the 4 funds, they could be the following:  Long-Term Bond Index (VBLTX), 500 Index (VFIAX), Total World Stock Index (VTWSX) and Total International Bond Index (VTABX).  There are other, non-Vanguard ways to do index – more on that in a different blog post.

Free Riders

There is an issue that results from indexing, which makes total sense if you think about it:  If everybody is buying index funds, who is out there watching individual companies and holding management of those companies responsible to maximize shareholder value?  The S&P 500 Index rises only if the individual 500 companies perform at their best.  They perform at their best only if the shareholders of those companies force them to do so.  That’s why there is what is called a Free Rider problem:  Index investors benefit from the diligence of the direct shareholders of the companies in the index.

IMO (In My Opinion)

I believe markets are moving toward more and more efficiency, mostly due to the increased speed at which information now flows.  As a result, it is becoming increasingly difficult to invest in individual stocks and outperform consistently over a long-term.  There is only one Warren Buffet, and his value-based methodology works for him because he has enough money to purchase entire companies, so he can decide how to deploy that company’s cash flow.  For the rest of us, Indexing keeps us in the market, keeps us diversified, and keeps us away from single-company or single-industry “non-systemic” risk.  There are ways, though, of either beating the Index, or of matching the Index with lower volatility risk, while remaining faithful to the EMH.  More on that in a later blog post, as well.


Gauss

Gauss

Carl Friedrich Gauss.  Have you ever heard of him?  He was a German mathematician from the early 1800’s.  Considered to be one of the greatest mathematicians ever.  Belongs on the Mount Rushmore of math geniuses, up there with Euclid, Newton, Einstein, and maybe your high school trigonometry teacher.  Personal friends with Ludwig von Beethoven (maybe not, but they were Germans of right about the same age, although Beethoven had moved to Austria).  

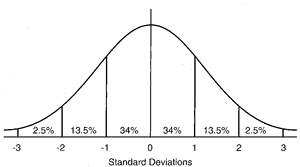
Why should an investor care about Gauss?  Because he came up with The Bell Curve, also known as the Normal Distribution Curve.  All of us have seen it:


There are several bodies of academic study at play here.  You have Probability Theory, which addresses the likelihood of a random event actually occurring.  You have Randomness, which, in the investment world, is the notion that investment returns are Random, and not a result of some reason or design.  Burton Malkiel, an American economist and author who remains active today, wrote “A Random Walk Down Wall Street”, which made famous the notion that investment returns are random.  Closely related is the Efficient Market Hypothesis, which posits that stock prices immediately reflect all available information, meaning that technical analysis and possibly fundamental analysis of individual stocks is futile.  All of these may be future blog topics.  Perhaps I can find an artist who can draw Gauss and Malkiel randomly walking hand-in-hand.

If investment returns are indeed Random, then they can be measured and graphed, and their graph would resemble the above Normal Distribution Curve.  Then, taking the next step, one can use that curve (and its inherent mathematics) to predict (with perhaps 68% or 95% probability) that future returns will fall within a plus-or-minus range of percentages.  

All of today’s algorithmic stock trading has its roots in Gauss’s work.  You could say C.F. Gauss is the gross-gross-grossvater of algorithms.  Gazillions of dollars, Euro, Yen, and other currencies are now at work under the assumption that Gauss was onto something.

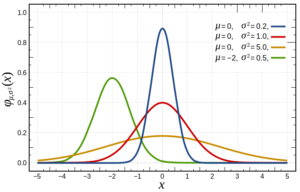
But what if Gauss was wrong?  What if future event outcomes do not look like past event outcomes?  Gauss himself offered answers to this, with the concepts known as Skewness and Kurtosis. The following chart represents a Normal Distribution (red line), a Skewed Distribution (green line) and two Kurtotic Distributions (flat, or Platykurtic, which is the yellow line, and steep, or Leptokurtic, which is the blue line).  


The green Skewed line shows that the bulk of the returns (or random events) are not concentrated around the Mean.  The Platykurtic yellow line shows returns that are not as concentrated around the mean as in the Normal distribution, and the Leptokurtic blue line shows returns highly concentrated around the mean.  So, Gauss had alternatives to the Normal state of things.

However, what none of these graphs show is a situation where many returns or events are far away from the Mean.  In other words, none of these show “Fat Tail” or “Black Swan” events.  The “tails” on these graphs are the extremes, at -5 or +5 standard deviations or even farther out on each extreme.  Imagine investment returns which are 5 or more standard deviations from the Mean – the Black Monday 1987 crash comes to mind, as does the 2008 correction that occurred over a longer (but still short) period of time.

Notice that these “Fat Tail” events I cited are to the downside.  There are numerous other examples in the world of individual stocks (i.e., Enron, and employees who lost everything there because all they owned was Enron stock).  An old saying is that stocks take the stairs up to the top and the elevator down.  So maybe the Distributions should have their right (or positive) leg close to the X axis but the left (negative) leg raised up a bit, maybe about to kill a bug on the ground?

IMO

I believe the Normal Distribution is a mostly but not fully accurate way of graphing investment returns and therefore a somewhat flawed way of predicting future returns.  If it was fully accurate, Long Term Capital Management would still be around (if you don’t know about its collapse in 1998, Google it).  I believe trading algorithms are very useful and have indeed made billionaires out of their best practitioners.  However, I also believe in Fat Tail/Black Swan risk, and that an investor needs to have some form of protection in place to guard against these risks.  Being diversified among asset classes, being liquid (i.e., able to sell quickly if Armageddon happens), and having a strong portfolio manager are all good forms of portfolio protection.  

The VIX

Today I am starting to blog.  My goal is to make 2 posts per week that will be informative for most investors.  Hopefully I will find topics that are current but that aren’t thoroughly explained in other places.  Let’s jump right in!

The VIX

Much is being written about the VIX, or the Volatility Index, because, despite its value dropping significantly, volume in VIX-related trading has boomed in the past 5 years.  Trading volume in VIX-related securities is at an all time high as I write this  Currently the VIX Index is at 11.46.  The VIX Index was under 10 during parts of last week.

What is the VIX?  What does VIX at 11.46 mean?  How can or should an investor use the VIX in their portfolio?

What is the VIX?

VIX is an index sponsored by the Chicago Board Options Exchange (CBOE).  It is an up to the minute reflection of option premiums on the S&P 500 Index Futures.  Option premiums are a function of the volatility of the underlying security – the more volatile, and higher the option premium.  Thus, the VIX is a reflection of volatility in the market for S&P 500 Index Futures.  The media has taken to calling the VIX the “fear index” because the VIX tends to rise when the S&P 500 index falls.  The VIX is forward-looking insofar as it is based on option premiums in the next 30 days.

What does the VIX value mean?

VIX is expressed as the expected 1 standard deviation of returns of the S&P 500 Index for the next year.  1 standard deviation means there is a 68% probability of an event happening.  VIX at 11.46 means that, based on options premiums, the market projects there is a 68% probability that the S&P 500 will be within a range of up or down 11.46% from its current level over the next year.  Mathematically, to convert this to a monthly projection, divide the index by the square root of 12 (3.46), meaning the projected 1 standard deviation of volatility for the S&P 500 is +/- 3.31%.  What do you think – does it seem likely (with 68% probability) that the S&P 500 will be within a range of 3.31% up or 3.31% down within the next 30 days?  I think it is probably a good guess.

What if the VIX was at 20?  Rule-of-thumb is that VIX at 20 indicates an elevated level of “fear” in the markets.  At 20, instead of +/- 3.31% over the next month, the options market is projecting S&P 500 returns of +/- 5.77% over the next month.  That’s a big difference.  

How does the VIX move in relation to the S&P 500?

Usually they will move in the opposite direction of one another.  And, usually the VIX will move will be a greater percentage than the S&P 500.  If the S&P 500 goes up say 1%, the VIX index  usually goes down by more than 1%, and vice versa.  As a result, many investors and funds managers use the VIX as a hedge against long positions in the S&P 500.

Does that mean VIX (or VX or VXX) is a good way to hedge?

Maybe.  VIX can hedge systemic (or system-wide) risk to long positions you have in the S&P 500 index, but it is not a pure hedge to individual stocks.  Moreover, because VX contracts expire every month, VX only works as a hedge for that month – you could purchase later month contracts, but you would pay a premium for doing so.  

Can an investor “own” the VIX Index?

No, but they can own a couple of proxies, one that I believe is better than the other.  The better is the VIX Future (VX), traded on the Globex Futures exchange.  The VX is a Futures contract that expires every month.  For that reason, my recommendation is to use the VX to hedge positions for not longer than 1 month.  The not-as-good proxy for the VIX Index is an exchange-traded fund with the symbol VXX.  I believe the VXX is not as good because its managers trade the VX, so an investor who owns VXX indirectly owns the VX Futures subject to the direction of the VXX managers, so owning the VX Futures is the better, more direct play for investors.

Is VIX too high or too low?

By answering this question, you are offering an opinion as to what you think others are thinking.  If you say VIX is too high, then you are saying the traders who invest in S&P 500 options are too skittish, not complacent enough, or not comfortable with Pax Oeconomia.  You are saying the economy going forward will be, if not robust, then at least very smooth and predictable.  If, on the other hand, you say VIX is too low, then you saying those S&P 500 options traders are too complacent, that they are maybe too young to remember the turmoil of the recent past (such as 2008 or August 2015), or that they need to remove their rose-colored glasses.

IMO (In My Opinion – A Feature of All of my Blog Postings)

I believe there is a lot more downside risk out there than is reflected in the current level of the VIX.  The market has risen so much since November 2016 that there are bound to be corrections.  Moreover, the rise since November 2016 is a continuation of the rise that commenced after the depths of the 2008-2009 correction caused by the sub-prime loan crisis.  The market has evolved a lot in the last 10 years, with program and high frequency trading now major sources of volume.  Dodd-Frank has taken traditional sources of market liquidity (commercial banks) out of the trading game, and they have been replaced by hedge funds and other private sources.  We don’t know what will happen to market liquidity if and when the market corrects more than these algorithms think that it will correct.  Will the hedge funds be there to shore up the markets?  We don’t know.  This is not to say that I think the market has topped and will now correct.  No, my indicators say we are still in a bull market.  However, I do believe there is a huge tail risk that is not encompassed in the current level of the VIX.  Lastly, I believe there are better hedges for your long positions than just owning VIX proxies:  1)  Always maintain a balanced portfolio that includes a diversified portfolio of equities, fixed income, and alternative assets such as commodity/futures funds; and 2)  Unless you devote much of your personal time to keeping track of the markets, you should have a manager who does constantly watch the markets and who will re-allocate your assets in the event of a major market correction.