Gold

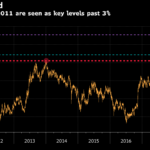
The price of an ounce of gold is virtually unchanged from a year ago.  As I write this on May 22, 2018, gold is trading at approximately $1,292 per ounce.  A year ago, May 22, 2017, gold closed at approximately $1,289 – $3 lower than where it is now.  This is not to say it has stayed right at that level the whole time – gold bottomed at about $1,225 in July 2017 and topped out at about $1,373 in January 2018, which is a 148-point range or about 11% of its current price.  However, at the end of the day, gold is right back where it was 1 year ago.

So What?

Why is it significant that gold is virtually unchanged over the past year?  I think it is significant because of what it says about the worldview of investors on a macro level.  There are at least 3 sources of the value of gold:

  • As a hedge against inflation;
  • As a safe haven during wartime, global unrest, or geopolitical uncertainty;
  • Due to its inherent beauty and related uses in jewelry.

If you watch TV news, we have had all kinds of geopolitical uncertainty during the past year, such as:

  • Trump is a loose cannon who may inadvertently start a nuclear war;
  • Syria is in the midst of a bloody civil war with Iran and Russia involved;
  • North Korea fires several rockets in the direction of Japan and conducts nuclear tests, after which Trump calls the Nork leader “Rocket Man”;
  • Iran continues to develop nuclear capability; Iran is revealed to be cheating on its “deal” and Trump withdraws from the “deal”;
  • Putin wins re-election and Russia continues to take an aggressive posture;
  • Oil goes up to over $70/barrel.

Despite all of that and the fear reported by our media, gold remains almost unchanged.  This tells me that investors see through the fear-based reporting and judge that the geopolitical threats now are about what they were a year ago.  North Korea most likely won’t attack us or our allies.  The other issues aren’t severe enough to upend the current geopolitical balance.  Not that everything is cool, but we are getting through all of this day by day.

Inflation

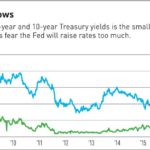
US Treasury rates are up by 80 to 100 basis points during the same period, depending on the maturity.  Higher interest rates do signal higher inflation in the future.  But gold remains unchanged.  Why?  Is gold no longer an inflation hedge?  Or is the sense that inflation may be higher but not yet so high that it will be a problem.  Maybe a little higher inflation is good!  We have been fighting de-flation for the past several years – maybe it is about time that ended.  Also, maybe it is the sense that the Central Banks will be able to control inflation with interest rate increases – if inflation increases but remains under control, perhaps there is not as much of a reason to buy gold.

Crypto

Another phenomenon during the past year has been the rise of Crypto – Bitcoin and the like.  Some call Bitcoin “digital gold”.  Perhaps for Millennials and younger investors, Crypto is replacing gold as a crisis hedge.  Perhaps this new emerging competition for the Chicken Littles out there is another reason gold is struggling.

William Devane

If you watch Cable TV you have no doubt seen ads to buy gold by actor William Devane and others.  These ads play to people’s fears.  Don’t fall for it.  While it is always good to own natural assets such as gold, the sky is not falling.  Even if it does fall, do you know for certain how gold will react?  While gold has done well during past crises, will it do so again?  We don’t know.  In the meantime, you could be foregoing upside in other asset classes if you put too much of your money in gold.  Anything in moderation is ok; too much may be harmful.  That applies to owning gold.

Roth Backdoor

There is a maximum income limit for contributing to a Roth IRA:  You cannot contribute to a Roth IRA if your income is over about $200,000 MFJ or $135,000 MFS.  If you are prohibited from contributing to a Roth IRA because your income (Modified Adjusted Gross Income, or MAGI) exceeds $200,000, then the good news is at least your MAGI exceeds $200,000.  A good problem to have, in a way.

Backdoor

However, there is a way around the income limit, and here is how it works:

  1. Make a non-deductible (meaning that you make the contribution with after-tax funds) contribution to a Traditional IRA, which doesn’t have an upper-income limit;
  2. Convert it at any point after you make the contribution into a Roth IRA.  This will involve setting up a separate account at the broker or bank where you have your IRA.
  3. Pay a tax, if any, on the conversion amount.

Is it legal?

Yes, it is, affirmatively so by the new 2018 Tax Bill, according to this article in a recent issue of the Investor’s Business Daily.  If this “backdoor” method is legal, then why doesn’t the IRS just get rid of the upper-income limit for the Roth IRA?  That’s a great question!  Here is another link to the IRS website that compares Traditional vs. Roth IRAs – very useful.

Roth Advantages

Both Roth and Traditional IRA’s grow tax-deferred as long as the money remains in the account.  The main advantage of the Roth IRA is that the money that you withdraw from a Roth IRA, once you are over 59 1/2 years old, is tax-free, as long as you have held the account for at least 5 years.  Contrast that with a Traditional IRA, withdrawals from which are taxed as ordinary income.  Who wants to pay taxes when they are retired and living off of money they have saved over the years?  A Roth structure is the way to accomplish tax-free money.

An additional advantage of a Roth IRA is that there is no Required Minimum Distribution or RMD.  Perhaps you think, “I have saved this money all of my life – of course I will want it when I get older!”  However, as they say, Stuff Happens, and RMD issue can become significant if you are trying to avoid or defer paying taxes for as long as possible.  With a Roth structure, you can avoid any RMD.  Maybe you can pass this money down to your heirs – there are rules for distribution in that case, but it will be your heirs’ problem.

Another Tactic

Think about using outside funds to pay any taxes you incur when you do a backdoor or conversion Roth.  Just because you owe taxes on a conversion doesn’t mean that you have to pay those taxes from your retirement funds.  If you have enough outside money, then think about using some of it to pay your conversion taxes so that you can keep 100% of your retirement money growing tax-deferred in your new Roth account.

Tax Bracket Arbitrage

Optimally, you should backdoor or convert to a Roth during a year when your tax bracket is lower.  This may be difficult to do if you are in your prime earning years and your income continues to go up.  Why add to your tax bill if it is already too high?  However, I look at it a different way:  When you retire, the last thing you want to worry about is having to pay more taxes.  It may be better for your mental wellbeing to pay more taxes while you are working so that you can enjoy tax-free income from your Roth when you are retired.  It may not make economic sense but it may make perfect lifestyle sense.

Contact a Planner

I competent Financial Planner can help you think through all of these issues.  Please contact me if you are giving thought to Traditional vs. Roth IRA’s.

Rent or Buy?

A young person who is taking Economics in school recently told me that their instructor told the class that they should buy a house early in life, before making any other investment.  While I question the instructor’s advice, it does once again bring up a point that has been debated for years, especially by those who are thinking of buying but aren’t sure if they really want to own a house:  Should I rent a place or should I buy a place?

My short answer:  It depends on your location and your time frame, and it is not purely an economic decision.  Owning a house may be part of the American Dream, but there are drawbacks to home ownership that may point the decision in the other direction for you.

Study

The Journal of Financial Planning is a monthly magazine I receive as part of my membership in the Financial Planning Association (FPA).  Each month the Journal publishes articles by Ph.D.’s about various financial planning issues.  The most recent issue (May 2018) has an article by Arthur Cox, Ph.D. and Richard Followill, Ph.D. titled “To Rent or Buy? A 30-Year Perspective”.   Here is a link to the article.  In it, they analyze whether people should have bought a house in 6 different US cities, or whether they should instead have invested their money in the markets and lived in rental housing.

Dr’s Cox and Followill conclude that it would have been better to buy a house in markets (San Francisco; Minneapolis) that have increased in value, and it would have been better to rent in markets (Chicago; Stamford, CT) that have decreased in value.  Not really an earth-shaking conclusion in my opinion.  They look at the rent/buy decision purely as a financial one, and they analyze only the financial aspects of the decision.

Problems

There are several problems with this rent/buy study and with any other decision one will make about renting vs. buying:

  • Apples vs. Oranges:  You are most likely not going to make a rent/buy decision regarding the same house or condo.  Instead, you will decide whether to buy this specific house or condo versus renting an apartment in a different location.  Yes, you may look at renting an entire house, but most likely it will be a single unit apartment.
  • You have to live there:  It is not just an economic decision.  You have to decide where you want to plop yourself every night after work.
  • It is a long-term decision:  The Ph.D.’s point out that you probably won’t make much money buying unless you live there for several years, in part because of the commissions and closing costs associated with selling your house.  The decision tilts more favorably toward buying when you smooth out these costs by holding the house for several years.
  • Moving:  Owning a house limits your ability to adapt if you need or want to change jobs and move to another city.  If you are not extremely confident of keeping your current job or at least finding another job in the same city, then you have to think very hard before buying a house.  I know a person who is stuck in a small town because they bought a house there and now they have retired and can’t find a buyer for their house and so they are stuck in the small town.
  • Property Taxes:  Here in California we have Proposition 13, which means property taxes can only increase a small percentage per year if you continue to own your home.  If you sell your home and buy a new place, however, your property taxes will be marked to market.  That means, if you move up, you also move up on your property tax basis, which can be a killer for the decision to move up to the big house.  Some older people can’t afford to sell their homes, meaning they can’t afford any more property taxes than they are already paying, and they can’t afford the rent that they would have to pay if they move to a rental.

IMO

I believe rent vs. buy is a lifestyle decision, first and foremost, with the financial aspect being secondary.  Yes, you can make a lot of money by buying and holding on to your home for many years, but it limits you in a number of ways.  In your rush to own a part of the American Dream, consider the significant downsides to owning.  Renting might not be a bad call for you if you are upwardly mobile.

Stock Buybacks

Apple just announced it would use $100 Billion of its cash hoard to buy back its own stock.  This Article says that S&P 500 companies spent $158 Billion during 1Q 2018 on stock buybacks – this is before the Apple announcement.  The same article (from the WSJ) argues that these stock buybacks have been effective as companies seek ways to use their cash to boost their stock prices.

Method

When a company buys back its stock, it is acting like any other investor.  It uses cash that it presumably has generated from its business operations to buy stock in the stock market, thereby taking that stock out of circulation from other investors and thereby paying cash to the investor who sold it to the company.  The laws of supply and demand work in this case:  The company acts to reduce the supply of the stock by buying some of it back, and thereby boost the price if demand stays the same or goes up.

Alternatives

How should a company deploy the positive cash flow it generates from its operations, presumably from the sale of its products or services?  Here are some (but not all) alternatives:

  1. The company could redeploy the cash back into the company in order to generate even more positive cash flow.  The decision process that follows this options is whether or not the project that they are thinking of redeploying cash into is accretive to earnings.  If the new project generates a greater profit than their already-existing operations, then the new project is accretive and the decision would be to go ahead with the new project.  If not, then not.
  2. The company could pay more to its employees – either pay the existing employees more, or hire more employees, or both.  Some companies are paying their employees more, either through higher wages or through one-time bonuses.  However, despite low unemployment (3.9% at the latest report), there is not strong upward pressure on wages in a macro sense, meaning companies don’t yet have to increase wages significantly in order to retain or hire new employees.
  3. The company could keep the cash.  It is nice for a company to have a rainy day fund.  The problem is that they don’t earn much money on undeployed cash because they mostly invest it in safe bonds or other investments which don’t offer strong returns.  It is bad for the Return on Assets ratio to keep a lot of cash.
  4. Dividends could be increased.  This is similar to stock buybacks in that it puts money into the pockets of existing shareholders.  The dividend path retains all existing stock and shareholders, whereas the buyback path seeks to pay off some existing shareholders and decrease the supply of stock.

IMO

Until wages start to grow, the buyback strategy is the best alternative for companies because it is an effective way to boost the stock price.  We may be getting to the point that wages will rocket upward, but not yet.  More likely, wages will move up slowly.  Companies are not being evil by not paying higher wages – Apple, for instance, already pays its employees very well.  Management’s first (but not only) responsibility is to its shareholders.  Lastly, tax cuts and/or a change in the tax code as it relates to cash that companies (such as Apple) keep in foreign banks are not the source of the cash used to buy back stock.  Rather, the companies’ operations are the source of the cash.  The change in the tax code merely results in more of the cash ultimately going back into the hands of the shareholders and less cash into the hands of government.

Confirmation Bias

Do you agree only with facts that support your viewpoint?  Do you make a decision about something and then go back and find evidence to support your decision and ignore facts that don’t support your decision?  If so, you may be a victim of Confirmation Bias.

Investing Problem

Confirmation bias is one of a number of logic mistakes people are guilty of when making investment decisions.  It is very difficult not to favor information or facts that back up your choices.  Confirmation bias in investing starts with a pre-conceived opinion about a stock.  The investor develops an opinion prior to looking at any of the data.  Let’s use Apple as an example.  You (as an investor) walk past an Apple store in the mall and see that it is packed with customers, and you interpolate from this that Apple’s future prospects are good.  You then go online to look up analyst reports and find that 28 of the 29 analysts that cover Apple have either a Strong Buy or Hold rating on the stock.  You conclude this is positive news that supports your positive outlook, and so you go ahead and buy the stock.  You may think you have done your own research by going to the Apple store and seeing the big crowd, but the analysts’ thoughts are not yours – they are the analysts’.  Just because they all on balance think Apple’s prospects are good doesn’t mean that Apple stock will go up.  For instance, the crowded store you saw:  Is it more or less crowded than it was 3, 6 or 12 months ago?  Or will it be more or less crowded 3 months from now?  The store evidence you saw was purely random and anecdotal.  The analyst reports you read fed your preconceived notion or bias that Apple’s prospects were good and that you would buy Apple stock.  Apple might go up, but your thought process was flawed in making the buy decision.

Herbalife

A good example of how Confirmation Bias played out in real life was Bill Ackman and Pershing Square’s shorting of Herbalife stock.  Ackman developed an opinion that Herbalife was a pyramid scheme and developed an argument based only on “evidence” that supported his position.  Ackman then went about taking a short position in Herbalife stock and then taking to the airwaves to badmouth Herbalife and thereby drive down the stock and increase the profitability of his short position.  The problem was that there was an equal amount of evidence that Herbalife’s multi-level marketing structure was legitimate and that the company’s sales were in fact growing and properly reported.  Ackman’s Confirmation Bias about Herbalife cost him dearly – as I wrote in “Short Selling” on March 13, 2018, Ackman lost at least $1 Billion on the failed Herbalife short and he has had to cut 25% of his staff as he covered the trade.

The Correct Mindset

Instead of developing an opinion and then going out and finding data that proves your opinion, you need to do it the other way around.  You need to approach it like Officer Joe Friday on Dragnet:  “Just the facts, Ma’am.”  Analyze all of the facts and then make a call based your analysis.  Don’t jump to conclusions – one of my father’s favorite sayings.  The crowded Apple store is good news, but you have to understand the context of that crowd, and determine what drives the crowd and whether it is likely to get more or less crowded in the future.

IMO

Confirmation Bias makes you feel more comfortable.  The proper method of analysis can make you uncomfortable.  Confirmation Bias is based on emotion and preconceived notions, but proper analysis is based on proper logic.  Don’t ignore data that doesn’t support your theory – at least address that data and determine whether or not it is valid.  Be more like Joe Friday, or like Missouri, the Show-Me State.  It is your money and you should not make logical mistakes with what you do with it.  Another way to minimize Confirmation Bias:  Stay diversified among asset classes, and look at mutual funds or ETF’s if you don’t have a lot of money to invest.

401K Millionaire

We Financial Planners are instructed that we should get our clients to set specific and measurable financial goals.  One goal that you should think about for yourself is to become a 401k Millionaire.  You read that phrase and you know exactly what it means:  You set a goal to have $1 Million in your 401k.  While it is not easy and it requires discipline over a number of years, such a goal is certainly attainable for those who can contribute to a 401k and who stay in their job (or at least stay in a job where they can contribute to a 401k) for many years.  If you are a public-sector employee, a 403b account has the same contribution limit so you can reach the same goal that way as well.

I enjoyed Slumdog Millionaire a few years back so here is a shot from that Academy Award-winning film from Danny Boyle:

Time Value of Money

Calculating how long it will take to become a 401k Millionaire is a simple Time Value of Money calculation on a financial calculator.  Say you start with nothing – you are young and have started a new job with a large employer.  You know you can contribute a maximum of $18,500 per year into your 401k, and you know you want to become a millionaire.  You figure, conservatively, that you can earn 5% per year on your account.  I have been using an HP 12c financial calculator for over 30 years, and I bought a new one last year.  They are much faster and less expensive than they were when I started, so I encourage you to get one or get a new one if yours is old.

To calculate how long it will take, use the following steps:

  • -$18,500 PMT (Your contribution/payment is an outflow from your standpoint, hence the negative sign)
  • $1,000,000 FV (Your Future Value goal is $1 Million)
  • 5 i (You think you can make 5%)
  • Solve for n

It turns out that n = 27, which means that you can become a 401k Millionaire if you contribute the current maximum to your account every year for 27 years.  If you are young, perhaps that 27-year-old who is just starting their first job, saving for 27 years may sound like forever.  However, if you think again about it, it really isn’t.  If you are 27 now, in another 27 years you will be 54, and you can have a 401k worth $1,000,000 if you just follow the rules.  Not easy, requires a lot of discipline, but very doable.

What if you think you can make 7% per year on average?  A little more difficult, but that’s in line with the return on the S&P 500 Index during the past 30 years.  At 7%, the time it takes to reach $1 million is reduced to 24 years.  You can have that $1 million by around Age 50 if you start early enough in your career.

A number of employers have an incentive program whereby they will match employee contributions up to a certain amount.  Employers do this to entice lower-compensated employees to save and contribute to a 401k.  Let’s assume the employer contributes $2,000 per year, which means the total of employee plus employer contribution is $20,500.  If that’s the case, and you earn the same 5% on your account, it takes only 26 years to reach $1 Million, thereby shaving 1 year off the time.  Better than a kick in the pants!

What if – there are a lot of what-ifs.  If you are intrigued by this notion of setting a tangible, measurable goal for your 401k and you are curious about how to factor in various changes to the base case of contributions, please contact me.  If you are older, or if you already have a 401k and want to know how you too can reach that goal, contact me and I can help set you in the right direction.

Two/Ten Spread

The 2/10 spread is the difference between the current yield on 10-Year US Treasury Notes and the current yield on 2-Year Treasury Notes.  The 2/10 spread in Treasuries is different than the 2/10 Split in bowling, which looks like this:

As I write this (on May Day), the 2/10 Treasury spread stands at 0.46% or 46 basis points, and it has been getting narrower.  Here is a (somewhat cut-off) chart from Investors Business Daily that shows that the 2/10 spread has been narrowing during the past few months:

Sorry that chart didn’t copy correctly but, trust me, the spread has narrowed from about 120 basis points at 1/1/17 to 46 basis points now.

Invert

The concern on Wall Street is that the 2/10 spread will invert, meaning that 2-year rates will be higher than 10-year rates.  This inverted spread has happened in the past but not for several years.  The inversion is a leading indicator of an upcoming recession.  Wall Street does not want the 2/10 spread to invert because that means the party is over or at least is most likely to end relatively soon.  It makes sense if you think about it:  If short-term rates are higher than long-term rates, that means there is greater uncertainty about the short-term than about the long-term.

The Fed

The 2/10 spread has been narrowing and is threatening to invert mostly because short-term rates have risen more than have long-term rates.  Short-term rates have risen substantially because the Fed has pushed rates higher during the past 2 years.  The Fed doesn’t set 2-year Treasury rates – market forces do – but market forces react directly to Fed moves and statements.  10-year rates are not as correlated to the Fed, so although 10-year rates have risen (about 50 basis points this year), they haven’t risen commensurate with 2-year rates.

Last week I wrote about the 10-year rate reaching 3%.  I also wrote about technical resistance levels.  Since reaching 3%, the 10-year rate has fallen back a bit and closed today at 2.96%.  I wrote that the 10-year has touched but not exceeded 3% several times in the recent past.  You could say that 3% is a Resistance level for the 10-year.  We will see if the 10-year yield is able to muscle through the resistance and stay higher than 3%.

IMO

I believe that inflation may be slightly higher than in the previous recent past but not significantly so.  I also believe this current Jerome Taylor-led Fed is not a hawkish, inflation-fighting Volker-type Fed.  The Fed has stated they intend to raise rates 3 times during 2018 and are contemplating a 4th rate raise.  I believe that the Fed will not continue to raise rates such that it will force the 2/10 spread to invert and thereby portend a recession.  As time goes on, if the 10-year doesn’t break above the 3% resistance level, I believe the Fed will re-think the 4-raise policy for 2018, and may even back down on 3 raises.  While I have also written that there is No Script for the Fed to rely on this time because we have not faced a backdrop of Quantitative Tightening, I think the threat of an inverted 2/10 spread is a more immediate factor that the Fed will consider and that they will come down on the side of letting the good times roll in the stock market.


Technical Witchcraft

In Finance classes that I have taken, two different instructors used the exact same phrase:  “Our next topic will be Technical Analysis, also known as “Witchcraft”.  Apparently, Finance instructors huddle together and decide what they like or don’t like, or the Chairman of the All-College Finance Department sends out a memo that tells instructors how to describe certain topics.

Instead of the Chairman of the Finance Department, I give you the Chairman of the Board, with one of his biggest hits:

Technical Analysis

Technical Analysis is everything related to looking at a chart of the past price performance of a stock and trying to derive some meaning out of the chart, or trying to predict how the stock will perform in the future based on what it has done in the past.  Disciples of Technical Analysis believe there are elements of human psychology that underlay the charts.  The increasingly prevalent world of quantitative trading has its roots in technical analysis.  Quant traders believe there are anomalies that can be found in sophisticated technical analysis that they can exploit for profit.

Resistance and Support

Two of the most well-known terms in Technical Analysis are Resistance and Support.  Resistance is a high point in the stock that was recently reached, perhaps even an all-time high.  When a stock reaches a high and then sells off, it is perhaps said that the stock is “consolidating” prior to trying to reach new highs.  The previous high point is the “resistance”, above which it will take a concerted effort by investors to achieve.  The following is an example of a Resistance line involving a stock that eventually broke above that line and made new highs:

To clarify, this is different than the “Resistance” movement that is working to thwart President Trump.

Support is the opposite of Resistance.  Support is a level which it is deemed difficult for the stock to drop below.  Here is an example of a Support line:

Moving Average

Another significant concept in Technical Analysis is Moving Average.  The most common Moving Average periods are the 50 Day and 200 Day Moving Average.  A Moving Average adds up the closing prices for each trading day and divides by the number of days.  As each day elapses, the farthest back day drops off of the average.  That’s why it is called a Moving Average.  The 200 Day Moving Average is, as its name implies, a longer-term indicator of the direction of a stock’s trading.  I use the 200 Day MA as a Sell indicator – if a stock (or an index) falls below its 200 Day MA, it is perhaps a time to sell, or at least not to buy.  Anything shorter-term, including the 50 Day MA, is not as meaningful as a trend indicator because even a 50 Day MA can be heavily influenced by short-term trading.

Efficient Market Theory

All Efficient Market Theorists, which may include you, believe Technical Analysis is worthless as a predictive tool.  Must be the Chairman of the Finance Department who sends out the memo is an Efficient Market Theorist.  If, as the Efficient Market Theory hypothesizes, stock prices are random, then there is no value to using charts of how the stock performed in the past to predict how it will do in the future.

IMO

I believe Technical Analysis can be useful as to the timing of when to buy or sell a stock.  Technical Analysis is tactics, not strategy.  I also believe Technical Analysis is more useful on a market index than it is on an individual stock.  During the “volatility spike” that commenced around February 1, 2018, the 200 Day Moving Average of the S&P 500 Index was put forward as an important line of defense for the index.  As it turned out, the 200 Day MA was touched on the downside but never really pushed through.  The S&P 500 Index has remained above its 200 Day MA, and that it has done so has provided solace to investors and traders who have been concerned that we are headed for a larger correction.  Regarding individual stocks, I believe it is more important to look at the context within which you are deciding to buy or sell.  Because most stocks trade with the broader market, and because most price movements by individual stocks can be explained by movements by the broader market, rather than to look at a stock’s technicals, it is more important to look at where the broader market is before deciding to buy or sell that stock.

3%

The 10-Year US Treasury is now yielding 3% (maybe just a bit under), which is up almost 100 basis points (1%) since late September 2017.  That is a relatively big move in a relatively short period of time, but not unprecedented.  The chart below from Bloomberg shows that the 10-Year rate moved from under 1.5% to over 2.5% during a 5 month period in the second half of 2016.  From late 2012 through all of 2013, the 10-Year moved from the 1.4%-range to 3.05%.  The point:  The 10-Year rate fluctuates more than do shorter-term rates because shorter-term rates are more pegged to Fed rate decisions.

Different This Time

What is different this time is that we are likely entering a period of Quantitative Tightening, reversing the Quantitative Easing period we had been in since the Great Recession.  This backdrop is why equity markets are not happy with the rise in rates.  Interest rate concerns are what sparked the initial correction in early February 2018.  The stock market seemed to steady itself as the 10-Year rate failed to hit the 3% marker, but the stock market now is correcting again as the 3% marker has been touched.

Bloomberg

This article from Bloomberg.com on April 20 offers a basic description of what the 10-Year at 3% means.  The main take from it, in my opinion, is that the 10-Year is set by market forces, while shorter-term rates (particularly rates under 1 year) are more tied to the Fed Funds rate.  The Bloomberg article states that the consensus of projections is that the 10-Year will end 2018 at the 3% level, meaning that rates should remain about stable for the rest of this year.  I doubt this – all markets have become more volatile this year and more volatility would mean that the end of the year will not look like it does today.

Ceiling to Floor

Another point the Bloomberg article makes is a technical one:  The 3% level on the 10-Year (Bloomberg actually uses 3.05%) could become a floor, after having been a ceiling for the past 7 years.  This means that if the 10-Year yield moves above 3.05%, it will be difficult to move it back below that yield.

IMO

Higher interest rates are a sign of a stronger economy, so you could look at the higher interest rates as good news.  I believe the stronger economy can be sustained even with the 10-year at 3%.  4% may be a different story.  Corporate earnings remain strong.  The debt-to-equity ratios of companies on a macro basis have been getting smaller, meaning that the effect of higher rates on corporate profits will not be as great as it was when the corporations had higher levels of debt.  Corporate tax rates are going down and that should more than compensate for higher interest rates.  If the consensus is right and the 10-Year rate remains around 3%, then this stock market correction will have been a buying opportunity.  Stay in the market, stay focused on the long term, and keep a diverse portfolio that can help you absorb this struggle that is playing out between those who are more concerned about higher rates and those who are not as concerned about higher rates.