Save Now for Medicare Costs

It is currently Open Enrollment for Medicare plans for those 65 years old and over.  Although most of my readers aren’t yet 65, some are, and some will be soon.  Like everything else, costs are going up.  No surprise there.  Although Part A is “free”,  Part B costs money based on your income, and Part C costs whatever your insurer says it costs.  One recent story said it can cost $20,000 per year per person for Medicare, which is probably in the ballpark.  The story went on to say some retirees are more afraid of what their health care will cost than what they will spend elsewhere in retirement.

Young Enough To Save

If you are still working and not yet of Medicare age (65), the time to worry about Medicare costs is now.  Why save all of the worry until you actually retire when you can start worrying now?  The younger you start saving, the more money you will have in retirement.

HSA

One strategy for saving for future Medicare costs is through a Health Savings Account, or HSA.  The IRS says you can have an HSA only if you have a “high deductible” health insurance plan.  As it is almost time for Open Enrollment for regular health insurance, you can see which plans are designated as “high deductible” and which are not.  Most high deductible plans are Bronze plans.  You cannot set up and contribute to an HSA unless you have a high deductible health care plan.

Your Money

The good news is that money you contribute to an HSA but that you don’t use during that calendar year is still your money.  This is unlike Flexible Spending Plans, which are actually deductions from salary that are “use it or lose it” for each calendar year.  Any money you don’t use in an HSA, you can save for next year…or for many years down the road,.

Use an HSA to Save for Medicare Costs

What I am suggesting is the following course of action:

  1. Enroll in a high deductible plan and open and contribute to an HSA.  For 2019, individuals can contribute up to $3,500 and families up to $7,000.  Some employers will also match a portion of your contributions, so look for this in your benefits package.
  2. Don’t withdraw money from your HSA during the current year.  Instead, let the money sit there and plan to use it when you retire.  It is like an IRA – earnings grow tax-free, and withdrawals are tax-free as long as they are for qualified medical expenses, including Medicare premiums.
  3. Instead, pay your current year medical deductibles out-of-pocket.  This will hurt at the outset of your plan year until you meet your deductible, then it will normalize.  The problem is, most workers’ take-home pay is lower earlier in the year because of Social Security taxes and perhaps also 401k contributions, so it is a big hit while you are also paying for higher medical deductibles at the same time.  However, this is short-term pain that will be worth it as your HSA builds.

How Much Can You Save?

Let’s say you start an HSA at age 55 (and I am suggesting you get started earlier).  If you save the maximum $7,000 per joint return for 10 years until you are Medicare-eligible, and you can earn 2% on it, using my financial calculator, you will save $76,648 in 10 years.  Although it is probably not enough to pay your Medicare premiums in full for the rest of your life, at least it will be a start.  Much better than no medical savings at all.  Again, withdrawals from the HSA to pay for Medicare costs will be tax-free to you.  

IMO

This is another way for me to tell you to eat your vegetables, but for those that just go to work every day, it is a good long term strategy for saving for retirement expenses and for limiting your taxes.

Put/Call Ratio

Particularly if you are a short-term trader, meaning that you trade index ETF’s or their options on a relatively frequent basis and that your hold period is relatively short, such as 1 to 5 days, then the Put/Call Ratio is an important piece of information.  

Calculation

The ratio is calculated just as its name is implied:  The total number of put options across all equities and indexes traded during a day divided by the total number of call options traded during a day.  Puts are options to sell and Calls are options to buy.  If more Puts than Calls are traded during the trading day, that means market sentiment is more bearish, or more with the Sells than the Buys, and the Put/Call ratio will probably be over 1.0.  Conversely, if more Calls than Puts are traded, market sentiment is bullish and the Put/Call Ratio will probably be below 1.0.

Chart

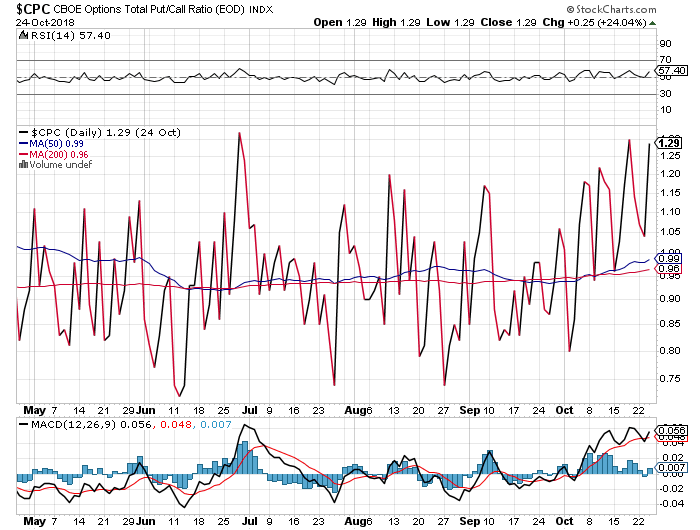
The following is a chart from StockCharts.com of the $CPC, which is the symbol for the Chicago Board Options Exchange Total Put/Call Ratio, End Of Day, as of the end of trading on Wednesday, October 24, 2018, a day when the major indexes sold off from 2% to 4%:

Interpretation of the Chart

There are several things that I find interesting about the chart, things that you might be able to use in your trading or at least in your understanding of what the Put/Call Ratio tells us about the current status of the market:

  • The Put/Call ratio closed at 1.29, which is extremely high.  As you can see, we haven’t gotten close to that figure very often since May.  This means the day’s trading of options was highly skewed toward the bearish Puts.
  • Notice what subsequently happened on the chart in prior times when the Put/Call Ratio exceeded 1.2, or even 1.15?  It quickly turned around and went back down.  This means that investors started to buy more Calls, and the market went back up.  The Put/Call Ratio doesn’t predict the magnitude of the change, but it does indicate when the market may be at an inflection point.
  • Conversely, notice what happens when the Put/Call Ratio gets too low, say below about 0.85?  It turns around and goes back up, meaning the overall market corrects.
  • The chart shows that the 200-Day Moving Average of the Put/Call Ratio is 0.95, or slightly below 1.0, which is what you would expect.
  • However, the 50-Day Moving Average is 0.99, which is higher than the 200-Day Moving Average, which indicates to me that market sentiment has turned more bearish in the shorter term than it is normally over the longer term.

Use it to Trade?

There has been quite a bit written about using the Put/Call Ratio to trade.  Google it and read for yourself.  Some articles use the daily ratio, while others use a moving average of the ratio to make decisions about trading.  My take is that, while I wouldn’t trade solely based on the Put/Call Ratio, I think it is a useful piece to use in your overall decision.

IMO

The chart that I use in this article goes back only to May 2018, and it is unwise to draw any conclusions from such a short period of data.  That said, we will see in the ensuing few trading days if we indeed entered the trading day on Thursday October 25 in an oversold position and that the market will rebound from there.  Even if the market does rebound, one should not draw a definitive conclusion from the move, but it is nice information to know.

Jack Bogle

Jack Bogle started Vanguard Group in the mid-1970 ’s and is also the founder of the index mutual fund.  Now frail and 89 years old, Bogle recently addressed a crowd of acolytes, known as Bogleheads, a gathering that was written about by Jason Zweig in the October 7, 2018 edition of the Wall Street Journal.

Simple and Cheap

Vanguard Group is by any measure one of the most successful company stories of any type in history.  Vanguard got there by holding to Jack Bogle’s maxim that investing should be simple and cheap for everybody.  Bogle and Vanguard created the index mutual fund so that individual investors could have access to a well-diversified portfolio of securities without having to pay the high fees associated with traditional mutual funds.  This is because index mutual funds are managed to adhere to the underlying index (such as the S&P 500 Index or the NASDAQ 100 Index) rather than managed to the whims of the portfolio manager.  Index mutual funds are therefore said to be “passively managed” and therefore don’t need nearly as much overhead to pay the managers.  That doesn’t mean they are any less diverse – on the contrary, one share of the S&P 500 Index Mutual Fund owns fractionally extremely small percentages of the 500 S&P companies.  Simple:  Buy just the Index Mutual Fund and have a very diversified portfolio; and Cheap:  Pay just a few hundredths of a percent of fees to Vanguard Group, vs. multiple percentages to other mutual fund companies.  The progress of technology has certainly helped Vanguard rise as it has.

Sage

I always enjoy reading what very successful industry veterans write or say about what they have learned over the years.  Based on Jason Zweig’s article, Jack Bogle seems to be a combination of Warren Buffet and Yogi Berra, perhaps without all of the malapropisms.  Here are some of Bogle’s quips, taken from Zweig’s article:

  • “Don’t look for the needle in the haystack.  Just buy the haystack.”  This is the rationale for buying index mutual funds instead of individual stocks.  You may find the needle, but likely you won’t, but you will benefit (if only fractionally) from the needle if you buy the whole haystack.
  • “The greatest enemies of the equity investor are expenses and emotions”.  In other words, keep it simple and cheap.
  • “In the fund business, you get what you don’t pay for.”
  • “While rational expectations can tell us what will happen, they can never tell us when.”  Meaning:  Don’t try to time the market, just invest in the index and hold it for the long term.
  • “I built a career out of knowing what I don’t know.”  Perhaps with a nod to Donald Rumsfeld, Bogle is saying that it is probably not possible to pick a portfolio that will beat the index over the longer term, so you may as well just own the index.

IMO

I am certainly an advocate that the investor’s interest is best served by keeping things Simple and Cheap by investing in diversified index ETF’s or mutual funds unless they have a particular expertise in an individual company or sector, and then only as a small percentage of the portfolio.  Jack Bogle’s and Vanguard Group’s innovations in personal finance have had an effect on individuals on a level as important as the iPhone, the automobile, or any other machine or gadget that we now take for granted.  To learn more, join bogleheads.com – it’s free.

What Does “End of the Bull Market” Mean?

Earlier in October, as you are probably aware, the stock market hit a rough patch.  The Dow declined almost 1,400 points during the two-day period of October 10-11.  I caught a segment on CNBC during that period and one of the guests opined that this is the “start of the end of the 10-Year bull market.”  What did he mean by that statement, and where would the indexes be if the bull market ends?

The End of The Bull

Bulls and Bears

The opposite of a bull market is a bear market.  We can only be in one or the other:  we are either in a bull market or a bear market.  We are currently still in a bull market.  A bear market is defined as a 20% (at least) drop from the previous high.  Thus, the current bull market will end when the indexes drop at least 20% from their highs.  

The S&P 500 Index reached 2,930 in late September 2018.  A 20% drop from that point would be to 2,344 or lower.  2,344 would put us back to about where we were at January 1, 2017, and would thereby erase all of the gains we have had since President Trump assumed office.  

Nasdaq

As for the Nasdaq 100 Index, the high was about 7,660 in late August 2018.  A 20% drop would be to at least 6,128, which is where the Nasdaq 100 Index was during the 2nd Quarter of 2017.  As I write this, we are currently about 7% below the August high, so we still have a good way to go before we hit the “bear market” definition.  While there are other indexes (the Dow Jones Industrial among them), these are the primary indexes that investors look at to define a bull or a bear market.

What Would Cause a Bear Market?

The market will drop 20% only if there is a reason to compel it to drop 20%.  There are several potential catalysts out there that could result in the 20% drop:

  • The Yield Curve could invert, meaning that short term rates yield more than long term rates.  While the Federal Reserve has been raising short term rates, long-term rates have been slower to go up, meaning the Yield Curve has tightened.  However, the October 10-11 sell-off was in part caused by higher long-term rates.  For instance, the 10-Year yield rose to about 3.2%, although it has since leveled off.  The rise in the 10-Year yield means there is less likelihood that the Yield Curve will invert.  Of course, things could change.
  • Our economy could dip into recession.  Most economists say, and I agree, that there is very little likelihood that we could dip into recession in the next 1-2 years.  GDP growth is robust and unemployment is low.  We have a labor shortage.  Most leading indicators are strong.  
  • An outside factor, such as China currency devaluation, trade wars that get out of control, or maybe even an armed conflict or other tragedy, could sink the market.  Of the possible causes of a bear market, I view this “Black Swan” concept as the most likely to occur.  

IMO

Doomsday predictions make for good TV especially on financial shows during days where the market is selling off.  Just because the market sells off for a couple of days doesn’t mean that the 10-year bull market is over and we are about to correct 20% into a bear market.  The best guess on where we are right now (as I write this) is that we are in a correction, which is different than a bear market, and that you should wait on making new purchases or adding to existing holdings until the correction sorts itself out.  Look at the correction we had during early February 2018:  We had a period of several weeks after that sell-off before the market regained its footing.  Wait at least for a couple of strong up-days before wading back in.  I don’t agree with the CNBC commentator that the end of the bull market is nigh.

Rebalancing Based On Wants

This thought-provoking article appeared in a recent edition of the Wall Street Journal.  The article offers a different opinion on how investors should think when they rebalance their portfolio.  Its ideas could offer some people a clearer way to think about their portfolio and their investment goals and could save them some time and money in the process.  Here is a link to the article titled “A Better Way to Think About Portfolio Rebalancing”.  

Risks vs. Wants

Dr. Meir Statman, Professor of Finance at Santa Clara University and the author of the article, says that instead of thinking about Risks of your portfolio, you should think about your financial goals, which he calls Wants.  Dr. Statman further whittles the universe of Wants down to two:  the desire to be Rich, and the desire not to be Poor.  I think that is a great way to think about your own investment goals.  Do you want to become Rich?  Or do you just not want to be Poor?

Offense vs. Defense

The desire to be Rich will probably mean taking a more offensive posture toward your portfolio construction. It will probably mean you will start out owning a higher percentage of equities, and it will probably mean you won’t rebalance your portfolio back in line when your equity percentage as part of your overall percentage grows due to growth in your equities.  If you want to become rich at the outset, you probably will still want to become rich as time goes on.  This will probably mean you won’t rebalance back to a 60/40 equity/fixed income split in a year or two.  

However, as you get older, probably much older, and your children are off the payroll and you are comfortable, perhaps your goals change from “get rich” to “don’t become poor”.  This would call for a more defensive portfolio:  stocks that are not as cyclical or subject to market risk, a more diversified portfolio, and probably a higher percentage in fixed income securities.  Once you change from “get rich” to “don’t become poor”, you probably won’t go back to “get rich”, and so you may not need to rebalance as often once you have the portfolio that meets your goals.

IMO

This all points to having a goals-based financial plan.  It is difficult to come up with your goals in a vacuum.  It is much better and easier to do so by working with a financial planner who can help you with your thought process.  We financial planners are taught to work with clients to articulate financial goals that are quantifiable and achievable.  Dr. Statman doesn’t go that far; he just wants you think about whether your goal is to “get rich” or “not be poor”.  That’s at least a start.  From there, you and your personal planner can work to quantify what “rich” or “not poor” means and construct a portfolio to get you there.

What Is Risk?

When investors use the term “Risk”, what do they mean?  For institutional-level investors, the answer to that question may not be what you think it is.

Risk

Risk is not just a board game.  It has several meanings to investment managers.  When ordinary investors talk about Risk, they probably equate Risk to the possibility of losing part or all of their investment.  To most of us, a “risky” investment means one that could more easily go wrong such that you won’t get all of your money back when you sell your investment.  That’s not a bad way to think about it, but there is more to the concept of Risk than just maybe losing money.

Not the Desired Outcome

If you take a step back from that standard definition of Risk, you might think of another meaning of Risk:  that actual investment returns don’t equate to projected or desired returns.  When you make an investment, such as the purchase of a stock, you have some expected return in mind.  If you don’t, you should.  The chance or the probability that your actual returns will be lower than your projected returns is the Risk of that particular investment.

Market Risk

Regarding stocks, there are two types of risk.  The first is called Systemic Risk or Market Risk.  This is the risk that the entire market will sell off and your stock will sell off along with the entire market.  Most stocks’ returns are highly correlated with market returns.  In theory, you can’t diversify your market risk by buying other stocks because all stocks are subject to market risk.

Company-Specific Risk

The other risk for stocks is the risk that is company-specific.  This is also called non-systemic risk.  This risk relates to how well your specific company is managed, and how well it performs relative to other stocks in its sector and other stocks in the market in general.  An investor can diversity non-systemic risk by buying other stocks.  The more stocks you own in your portfolio, especially different stocks among different sectors, the less subject you are to company-specific risk.

Insurance

There is also the Insurance definition of Risk, which is the situation where the probability of a variable is known but where the mode or actual value of the occurrence is not known.  You know that there is a possibility that your house can catch fire – that’s a risk – but you don’t know if it will ever catch fire or when it will catch fire.  In general, it is similar to the securities definition of risk, which is that something bad or unexpected might happen.

IMO

Risk doesn’t just mean losing money or the possibility of losing money.  Risk also means that you make money, but not as much as you expected to make.  You might someday get into a conversation with another investor or investment manager about the concept of Risk, and you should know what they mean when they discuss Risk.  It is not the board game by Hasbro.

StrengthsFinder 2.0

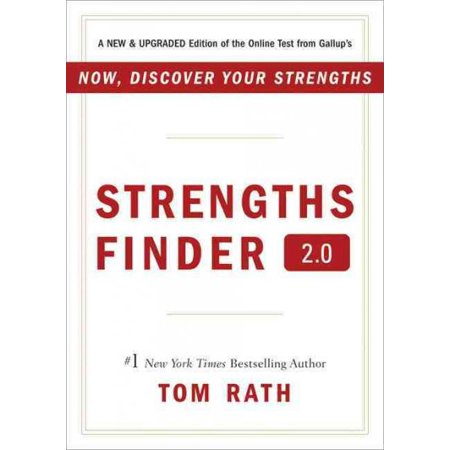
StrengthsFinder 2.0 is a self-help book written by Tom Rath and published by Gallup, of polling fame.  The book itself is short but, by buying the book, you are granted entrance into the StrengthsFinder website, whereupon you can take a self-assessment test.  The assessment test is the real value of the book.  The test asks you various questions.  When you finish the test, based on your answers, the website immediately gives you its results, meaning it tells you what your greatest personal strengths are among 34 strength traits that the book delineates.  The results are given in a very positive manner such that anyone who takes the test and gets the results will feel good about themselves no matter what the results of the test are.  

A Publishing Phenomenon

Publishing Phenomenon

StrengthsFinder 2.0 has been a publishing and sales phenomenon as about 20 million copies of the book have been sold cumulatively since its initial publication in 2007, according to the Gallup website.  I think this has to do with the desire of people to know more about themselves (as also shown in the rise in popularity of genetic testing through 23andme.com and the like) and with the positive way Gallup handles this assessment test.  Brevity also helps.  There have been oodles of self-help books published over the years, going back to How to Win Friends and Influence People by Dale Carnegie or even going back to The Bible.  StrengthsFinder 2.0 has been out there and relevant longer than most.

My Strengths

The assessment test spits out your 5 greatest strengths out of 34.  My 5 greatest strengths are:

  • Learning
  • Ideation (coming up with ideas and presenting them)
  • Relating to others
  • Empathy
  • Arranging or ordering things

I feel like, for me, the assessment test provided an accurate account of my strongest abilities.  As you can see, they are general abilities and not specific to any field or discipline.  You can take it the next step and think about what type of work you should get into given the strengths you have.  However, for me it is useful to know that this self-assessment confirmed what I am good at.  

IMO

If you haven’t already done so, I highly recommend buying StrengthsFinder 2.0 and reading it and taking the test.  The first step of financial planning is taking an assessment where you are financially with your life, and part of that is to understand yourself better.  Your skills and personality can change over time (that’s why we go to College and work!) and so you should know where you’re at before you can know where you’re going.  Sounds like a Bob Dylan lyric, but it is true.  If you are thinking of jumping on the 23andme.com bandwagon and spitting into a cup and mailing it in, then you should also buy StrengthsFinder 2.0 and take the self-assessment test.  It will help you make a financial plan that works for you.

200 Day Moving Average

I like to write about the significance of various technical indicators and so today’s topic is the 200-Day Moving Average.  200 trading days is about 40 weeks of trading, and so the 200-Day MA encompasses the better part of the previous year of trading.  For that reason, it is a good technical indicator of the long-term trend of a stock’s trading pattern.  

Standard

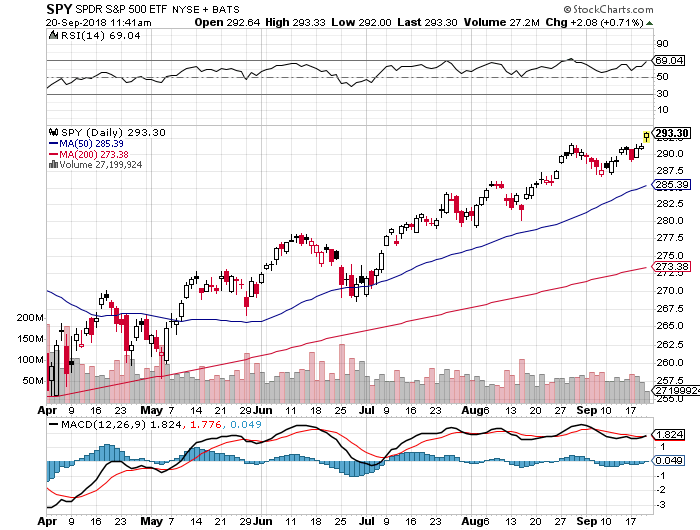
The 200-Day MA is a standard technical indicator that you can easily find on any free stock charting service, such as stockcharts.com.  In this chart of the S&P 500 Index ETF (SPY), the 200-Day MA is the red line that has a current value of $273.39 as highlighted:

You can see that the 200-Day line is pretty constant and doesn’t have much variability, due to its having 200 data points.  You can easily tell what the 200-Day MA is on this or on any stock chart.

Uses

  • Its main use is to see where the stock is currently trading in relation to the 200-Day MA.  If the stock is trading above the 200-Day line, then the 200-Day line is likely to continue to move upward. 
  • The alarms go off, however, when the stock falls and threatens to fall below or actually does fall below the 200-Day line.  This is likely a signal to Sell if you own a position in the stock, and a signal not to buy if you are just looking at it.  It means institutional money is selling the stock, or that something has changed in the company or the sector or in the market in general such that the future is probably not rosy. 
  • Another bearish sign is if the 50-Day Moving Average line dips below the 200-Day MA line.  This is called a “death cross” and could occur even if the current price of the stock is above the 200-Day line.

IMO

I sell long positions that dip below the 200-Day Moving average, if I haven’t already sold them.  Don’t hold on to losing positions in the hope that they will rebound and you can recoup your money.  You may recoup your money, but it may take a long time and at an opportunity cost of missing out on other positions that may outperform your losing position.  The 200-Day MA can work as well for index ETF’s as it can for individual stock positions, perhaps even better because there is so much trading information inherent in an index ETF made up of that many individual positions.  Just be aware of that stable red line on most free stock charting services and know what it means and how to use it.


Get Help To Make Decisions

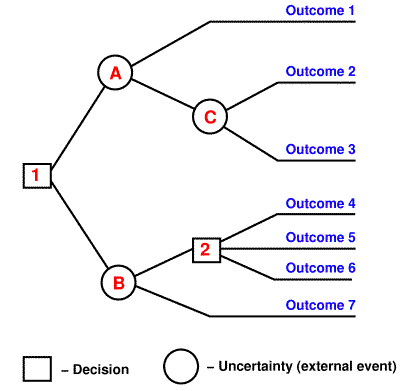
Think about how difficult it is sometimes to pick what you want from a menu at a restaurant.  How do you make that decision?  Do you base it on what you feel like eating that evening?  Or on what this restaurant specializes in?  Do you consider what you ate yesterday or what you are planning to eat tomorrow?  

Choosing a meal is a small decision.  No matter what you choose, you will be hungry again the next day and want another meal.  Time passes.

Decision Tree

Big Decisions

By contrast, what you do with your finances are big decisions that are difficult to make for a number of reasons, including the following:

  • You may not know what you want, or what your goals are.  The currently topical field of Behavioral Economics teaches us that individuals are very bad at knowing what their goals are, especially in the context of big financial decisions.
  • You may not know what your options are.  This may have to do with a lack of knowledge of the current law, or of potential financial solutions that are out there in the marketplace.
  • You may not know what your current resources are or what you are capable of.  It is difficult to comb through one’s own finances and understand where they currently sit, which is the first essential step to determine where they want to go.

Get Help!

Without knowing your situation personally, the best piece of advice I can provide is that you need to get help from a qualified financial planner as you set goals and make decisions to set out on a path toward achieving those goals.  Even in the restaurant situation I describe above, you might enlist help from others around – your dining partners, for instance, or the wait staff.  If you are self-confident and feel like you make good decisions without the help of others:  All the more reason to work with a financial planner, because you might have what is called Confidence Bias in Behavioral Economics.  Most importantly:  Don’t rely on a spouse as your financial planner.  There is too much other baggage in a marriage relationship to make good financial decisions without enlisting the help of third-party experts.  Yes, you need to work with your spouse, but the married couple together in turn needs to work with the third party.  

IMO

There is a new book out by author Steven Johnson titled “Farsighted”, which is about how to make good decisions.  Reading a review of the book gave me the idea to write this blog.  The act of reading a book such as this or Googling “How to Make Decisions” and reading the articles that pop up is itself a way of getting help to make decisions.  Why not, instead, work with a financial planner who is trained to work with people to help them set goals and make and implement plans to achieve those goals?  I know, financial planners are more expensive than books and free articles.  However, as with anything else, you get what you pay for.  You are going to get a more personalized and valuable experience by working one on one with the planner, and you will likely easily recoup the money you spend on the planner.  Please feel free to contact me if you are having difficulty sorting through your financial life and figuring out where you want to go next.