

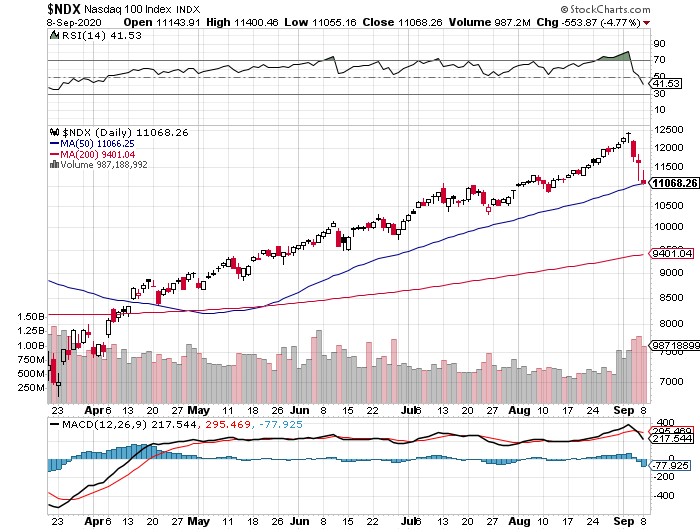
Investing these days is not for the faint of heart! After going nearly straight up since late March, stock markets have tumbled over the past week. Yesterday, the S&P 500 Index closed 2.8% lower and the tech-heavy Nasdaq 100 Index closed about 4.8% lower, touching its 50-Day moving average in the process.
50-Day Moving Average
Rather than to delve into the reasons why I think the stock market does what it does, let’s discuss the 50-Day moving average and why it may be significant. The “simple” moving average is calculated by taking the closing price over the previous 50 trading days, dividing that number by 50, and plotting the result over time. The moving average gives you a better sense of the direction of a market than does looking at day-to-day data. The 50-day moving average is a technical indicator of strength or weakness. An upward-sloping line indicates strength, and vice-versa. The exponential or logarithmic moving averages are variations that some believe are more useful than the simple moving average.
Buy, Sell, or Hold?
Does this mean one should buy a stock (or an index or index fund) if its current price is above an upward-sloping moving average, or sell if is below the moving average? What if the moving average is downward-sloping? What should an investor do then? There are no hard and fast answers to these questions, but you could backtest all of those possibilities and perhaps come up with a killer trading algorithm.
Resistance or Support
Another “use” of the 50-Day moving average is as an indication of support or resistance. In the current case of the Nasdaq 100 Index falling to touch its 50-Day moving average, we can look over the next few trading days to see if the moving average becomes a support level. Some investors may see a dip to the 50-Day moving average as a buying opportunity. If enough investors see it as such and buy, then one could view it as a support level and drive the price higher. On the other hand, if the Nasdaq 100 index falls significantly below the 50-Day, then it will have breached an important support level and it could fall significantly more. It would mean that the markets are so weak that there are not enough buyers that want to buy the stock even at the key support level.
IMO
In the chart of the Nasdaq 100 Index above, the 50-Day moving average is the blue line. Let’s watch over the next several trading days to see if the index moves up or down from here. If it moves up, we can conclude that the 50-Day will have provided support to the index and that the upward trend continues. If not, then we might say, “Watch out below!”. It could get ugly if that is the case.