

Today I will go into the “Cup and Handle” pattern, which is a chart reading technique that may or may not help you on the road to riches. I don’t advocate its usefulness one way or another, but you should be aware of it because you may be looking at a stock chart someday and think you may see the cup and handle, and you may be right, or you may be wrong.
Example
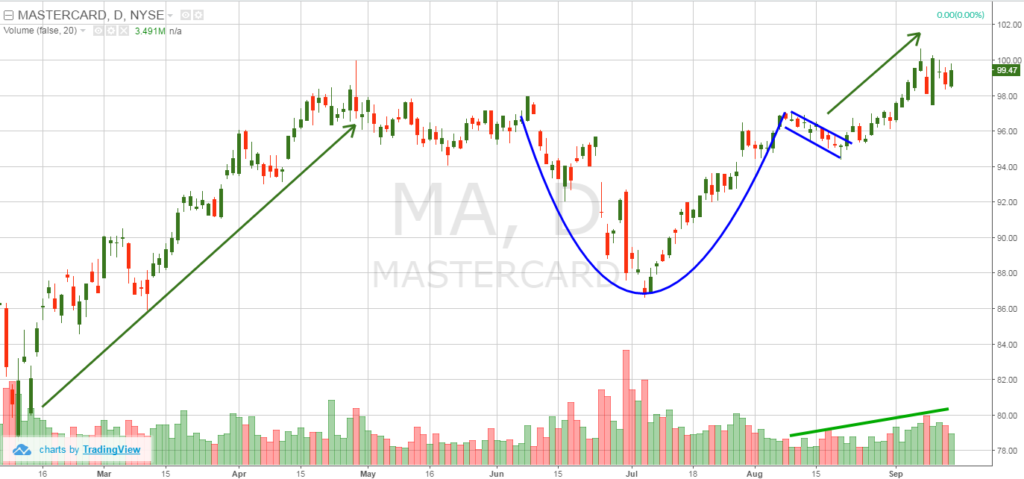
The chart above is an example of a cup and handle pattern. The cup is the u-shaped formation underlined in blue, and the handle is the relatively short period outlined in blue wherein the stock reaches back to its high and then sells off slightly. Proponents of the cup and handle will tell you the time to buy is when the stock reverses its “handle” sell-off and then breaks above its prior high. In this chart (of Mastercard stock a couple years back), the buy period is in late August or early September, if you can read the dates.
Patience
One key of making use of the cup and handle pattern is patience. You need to wait for the pattern to develop. Think about the National Football League, when the commentator says the running back needs to be patient and wait for his blocking to develop. It might have been tempting to buy when the stock began to retrace gains it had made early in the chart – during what is called the “consolidation” phase of the stock. If you did buy during consolidation, you may have made out ok, but you may also have had to wait a while before you were proven right. The psychology behind it is that investors make money on the way up (early in the time period shown in the chart), then do some profit-taking perhaps because they see other, better opportunities out there. When old investors sell, new investors come in, while the company keeps improving its profits and cash flow. As the consolidation phase gets later in the cycle, the new investors hold on because they haven’t made their money yet. That’s when the handle forms, and then the company makes new highs (according to cup and handle proponents).
More Patience
You can see from this chart that it takes weeks and months to go through the consolidation phase and to form the cup and handle pattern. If you are a short-term or even a day-trader and you see a pattern that looks something like a cup and handle, it isn’t. Your eyes are deceiving you. Although the emotional cycle of an investor has admittedly been sped up in recent years, a true cup and handle takes a long time to develop and is not a pattern to be used for day trading.
Investors Business Daily
One of the main proponents of the cup and handle pattern is the newspaper (now website) Investors Business Daily and its founder, William O’Neil. IBD puts on one-day training sessions and teaches how to look for and use the cup and handle as its main trading tool. IBD claims to have tested it and it works – that’s their claim, not mine. That said, IBD does a great job identifying stocks that tend to go up over the long term. I am an IBD subscriber, though I don’t trade based on their cup and handle recommendations.
IMO
Again, my only objective is to educate my readership about cup and handle patterns and to recognize one when you see one, when you are spending time inputting stock ticker symbols into free stock chart websites such as stockcharts.com or finviz.com. Make sure the pattern you see has taken weeks or months to develop because, even today, that’s how long it takes for investor psychology to evolve from a profit-taking phase to a more long-term hold phase.