

One technique that financial planners use is a Monte Carlo analysis. Named after the famous European casino, the Monte Carlo analysis is an attempt to project what will happen in the future given a whole list of variables that might affect the outcome of an event. Financial planners use a Monte Carlo analysis to attempt to answer the question, “What is the probability that this client will have enough money to live comfortably during retirement?”
Fixed Point
To do a Monte Carlo analysis, start with a fixed point in time – usually the present time. Add variables, including but not limited to the following:
- Total dollar amount of assets
- Mix of assets
- Future performance of each individual investment
- Age of the client now and age of proposed retirement
- Number of dependents
- Health of the dependent and health care spending requirements
As you can imagine, these are all huge life-varying assumptions that can flow in any number of different ways. That’s why we need the power of modern computing to make some sense of it all. Monte Carlo analysis would not be possible without computers and software.
Plot
When the assumptions are all input, the software pings all of these assumptions off of one another and spits out a chart that looks like a spaghetti chart. In fact, the spaghetti chart that hurricane forecasters display is a type of Monte Carlo analysis. Here is an example of a Monte Carlo chart:
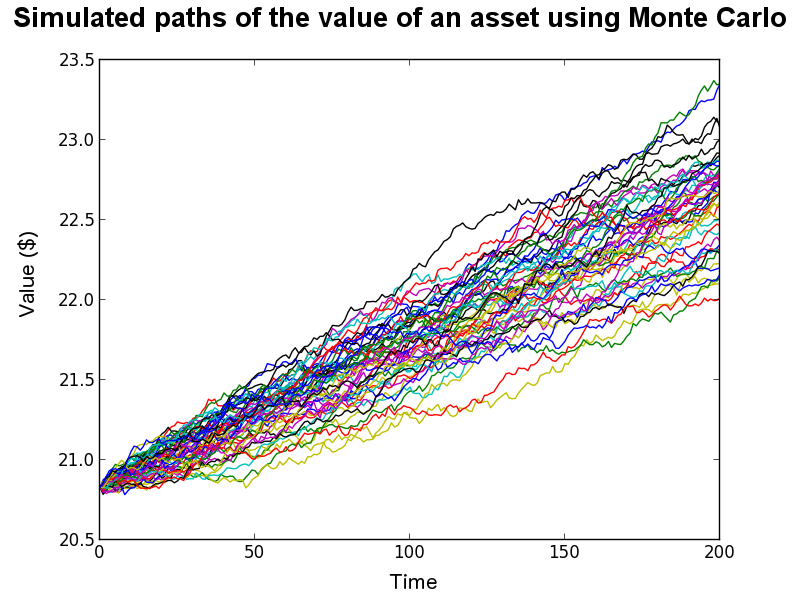
Each line on the plot represents a potential outcome given the input factors. As you can see, most of the colored lines are bunched in the middle. That phenomenon gives rise to the second aspect of Monte Carlo analysis, which is the standard distribution analysis, which looks like this:
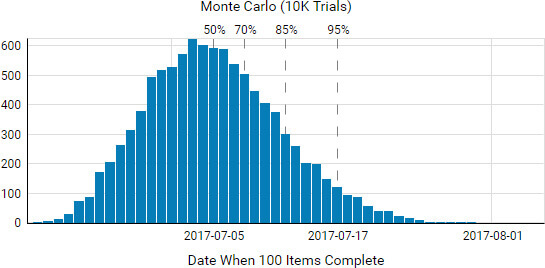
Bell Curve
This chart is a fairly standard Bell Curve chart. From this, the planner can determine what is the most likely outcome, and what outcomes are likely within 1-2 standard deviations of the mean, or most likely. At the end of the analysis, the planner would like to say something like, with 95% probability, this client will be able to retire comfortably if they continue to do the following list of behaviors that they need to do to ensure that 95% probability. Thus the Monte Carlo simulation can act as a guide for how the client needs to live their life going forward if they want to achieve their financial goals.
Software
There are a number of software packages out there that financial planners use to perform Monte Carlo analysis, including Money Guide Pro and eMoney Advisor, among many others. Each planner has their own favorite. All have advantages and disadvantages. You can even do it yourself for free using Excel and add-on software you can download. Just Google it and find out. As with anything else, you get what you pay for, and remember GIGO (garbage in, garbage out). It’s best to pay for a financial planner and use their state of the art software.
IMO
Just be aware that Monte Carlo analysis is a common tool for financial planners and one that you can avail yourself of if you contact me or your current planner. It can help you make decisions going forward and it can help you see how you are doing versus how you thought you might do when you made the plan. Elections, sports, investing, weather – all activities are moving in the direction of analytics and probability and Monte Carlo analysis will also move you in that direction. Welcome to the 21st Century!