

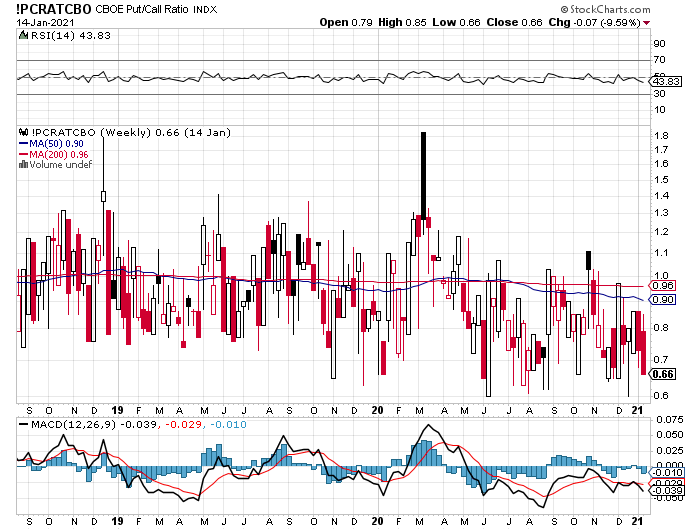
The Put/Call Ratio is currently low: 0.66 according to the chart below. That is as low as we have seen in the last 18 months (per the chart), and is in fact as low as it is been in the last 10 years. As it is a contrarian indicator, the Put/Call Ratio at the low 0.66 level is not a good sign for the near future. It means the stock market is currently over-bought.
Meaning
Puts are options to sell stocks at a specific “strike” price and Calls are options to buy stocks at a specific “strike” price. Investors who buy Calls look for the underlying stock to go up, and Put buyers look for the stock to go down. Calls are optimistic plays, and Puts are pessimistic plays. When more Calls are purchased in aggregate than are Puts, the Put/Call ratio will be below 1, and vice versa. The ratio is normally slightly below 1 – the chart shows that its 200-day moving average is 0.96 – because stocks tend to go up more than down. Notice also in the chart that the Put/Call Ratio was about 1.8 back in March 2020, which is when we had our bear market correction as a result of the initial Coronavirus economic shutdown.
Contrarian
However, when the Put/Call Ratio moves more than 1 standard deviation from the mean, where it is now, it will likely mean revert back. That means the ratio will go up from its current 0.66, which means more puts will be bought than they are now, which means the stock market is likely headed lower in the near future until the ratio is more normalized.
IMO
It is a good idea to keep an eye on the Put/Call Ratio when you are trying to figure out if and when the market might reverse itself. Right now, it doesn’t look promising because the ratio is extremely low. Let’s see if it eases back to a more normalized number, or if the change is more drastic. Likely more drastic, if the past is any guide. Watch it!