

Relative Strength Index (RSI) is a commonly-used technical indicator. RSI is a momentum oscillator that measures the speed and change of price movements. RSI is presented as a number between 0 and 100. A high number within that range indicates that a stock has been performing well, and a low number indicates the opposite. A number between 30 and 70 is considered normal by the “experts”. A number below 30 is thought to mean that the stock is oversold, while a number above 70 may mean the stock is overbought and therefore may be ripe for a correction. Maybe. I will get into that below. Here is a link from Stockcharts.com/school that gets into RSI more deeply, including how to calculate the RSI. RSI’s calculation includes a running lookback period of 14 days, meaning that data from more than 14 trading days ago is no longer relevant.
Free
When you go to the free stock charting website Stockcharts.com and type in a ticker symbol, in addition to a daily chart of the stock for the past several months, you will also get a chart of the stock’s RSI, typically shown above the actual stock chart.
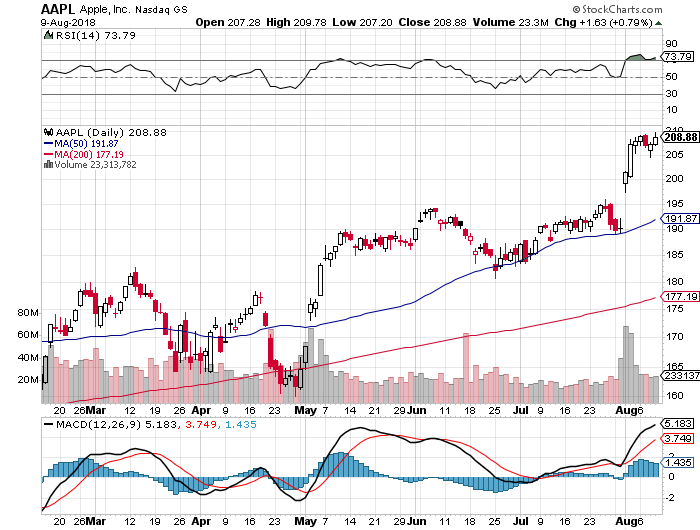
AAPL
Just to use one example, this of the now $1 Trillion Apple, Inc., the RSI of AAPL (as of this writing) is 73.79. By the book, this means AAPL may be overbought since it is over 70. However, let’s look at this more closely. AAPL last week announced strong earnings, which caused the stock to bread that $1 Trillion barrier. Kind of like Chuck Yeager and Mach I, or Roger Bannister and the 4 Minute Mile. Do you think AAPL is ripe for a correction? I don’t believe it is, but it certainly might.
S&P 500
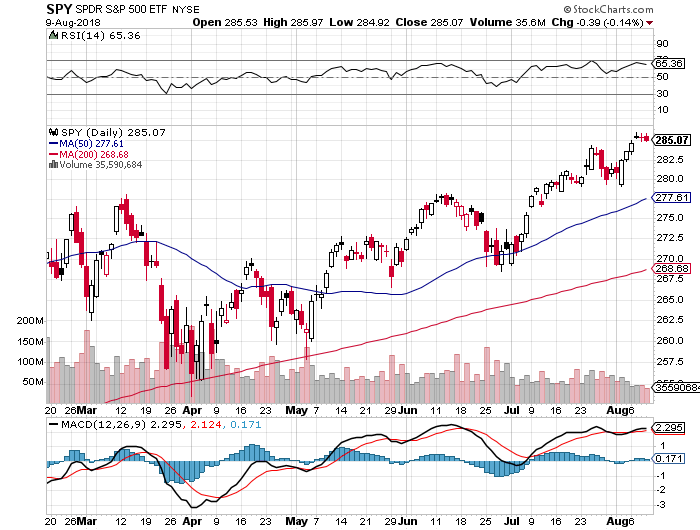
The RSI is also helpful as applied to indexes, such as the S&P 500 Index. Below is a chart of the SPY, which is the ETF proxy to the S&P 500 Index. Its RSI currently is 66.36, which is high but still below the 70 “barrier”. This implies that the S&P 500, while high, is not overbought and therefore may have room to run upward still.
In My Opinion (IMO)
The purpose of this posting is to inform, not to advocate. The Relative Strength Indicator is out there as a piece of information to take into account when looking at your holdings to determine whether to buy, hold, or sell. I do not recommend that you make trading decisions solely based on the RSI, such as, “The RSI is below 30! Great Buying Opportunity! I must buy!” Don’t do that! Just be aware of the RSI and what it implies and you will be a more educated investor. With a later posting I will discuss the other information on this chart, such as the MACD, which is the stock’s moving average.