

In Finance classes that I have taken, two different instructors used the exact same phrase: “Our next topic will be Technical Analysis, also known as “Witchcraft”. Apparently, Finance instructors huddle together and decide what they like or don’t like, or the Chairman of the All-College Finance Department sends out a memo that tells instructors how to describe certain topics.
Instead of the Chairman of the Finance Department, I give you the Chairman of the Board, with one of his biggest hits:

Technical Analysis
Technical Analysis is everything related to looking at a chart of the past price performance of a stock and trying to derive some meaning out of the chart, or trying to predict how the stock will perform in the future based on what it has done in the past. Disciples of Technical Analysis believe there are elements of human psychology that underlay the charts. The increasingly prevalent world of quantitative trading has its roots in technical analysis. Quant traders believe there are anomalies that can be found in sophisticated technical analysis that they can exploit for profit.
Resistance and Support
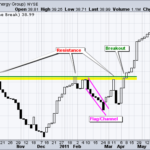
Two of the most well-known terms in Technical Analysis are Resistance and Support. Resistance is a high point in the stock that was recently reached, perhaps even an all-time high. When a stock reaches a high and then sells off, it is perhaps said that the stock is “consolidating” prior to trying to reach new highs. The previous high point is the “resistance”, above which it will take a concerted effort by investors to achieve. The following is an example of a Resistance line involving a stock that eventually broke above that line and made new highs:
To clarify, this is different than the “Resistance” movement that is working to thwart President Trump.
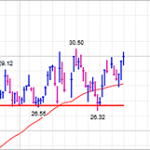
Support is the opposite of Resistance. Support is a level which it is deemed difficult for the stock to drop below. Here is an example of a Support line:
Moving Average
Another significant concept in Technical Analysis is Moving Average. The most common Moving Average periods are the 50 Day and 200 Day Moving Average. A Moving Average adds up the closing prices for each trading day and divides by the number of days. As each day elapses, the farthest back day drops off of the average. That’s why it is called a Moving Average. The 200 Day Moving Average is, as its name implies, a longer-term indicator of the direction of a stock’s trading. I use the 200 Day MA as a Sell indicator – if a stock (or an index) falls below its 200 Day MA, it is perhaps a time to sell, or at least not to buy. Anything shorter-term, including the 50 Day MA, is not as meaningful as a trend indicator because even a 50 Day MA can be heavily influenced by short-term trading.
Efficient Market Theory
All Efficient Market Theorists, which may include you, believe Technical Analysis is worthless as a predictive tool. Must be the Chairman of the Finance Department who sends out the memo is an Efficient Market Theorist. If, as the Efficient Market Theory hypothesizes, stock prices are random, then there is no value to using charts of how the stock performed in the past to predict how it will do in the future.
IMO
I believe Technical Analysis can be useful as to the timing of when to buy or sell a stock. Technical Analysis is tactics, not strategy. I also believe Technical Analysis is more useful on a market index than it is on an individual stock. During the “volatility spike” that commenced around February 1, 2018, the 200 Day Moving Average of the S&P 500 Index was put forward as an important line of defense for the index. As it turned out, the 200 Day MA was touched on the downside but never really pushed through. The S&P 500 Index has remained above its 200 Day MA, and that it has done so has provided solace to investors and traders who have been concerned that we are headed for a larger correction. Regarding individual stocks, I believe it is more important to look at the context within which you are deciding to buy or sell. Because most stocks trade with the broader market, and because most price movements by individual stocks can be explained by movements by the broader market, rather than to look at a stock’s technicals, it is more important to look at where the broader market is before deciding to buy or sell that stock.