Sucked Out

We are all horrified and saddened by the ordeal of Jennifer Riordan, the Southwest Airlines passenger who was nearly sucked out of the airplane and later passed away after the plane blew an engine, spewing parts that struck open the window next to Ms. Riordan.  Kudos to the brave passengers and crew that tried to help her and to the pilot who somehow landed the plane without additional deaths.  It is the worst nightmare of any of us who fly.

Metaphor

If you fly, I’m sure that you think about something like this happening to you.  Do you also think about the same thing happening to you and your investment portfolio, your life savings, in a metaphorical sense?  That something bad will happen completely out of your control which causes rapid decompression in the financial markets and your life savings get sucked out the window?  Your savings are gone, poof!  Sucked out of the fuselage of your life journey.

Safeguards

Fortunately, unless you make some really poor choices, like putting all of your life savings into something very risky, your investment portfolio will not suffer the same fate.  Markets can drop quickly – the 1,000+ point drop in the DJIA on February 5 was a case in point – but even that was only 4%, and markets have somewhat stabilized since then.  The poor choice that would have resulted in your portfolio being sucked out the window then was being extremely short the VIX Volatility Index.  No able financial advisor would have recommended going all-in on the short-the-VIX strategy.  Old enough to remember the 22% drop on October 19, 1987?  If your seatbelt was strapped on, you were able to ride that short-term turbulence and recover your losses from that day in short order.

My point is that the stock (or bond) market doesn’t experience rapid decompression to zero.  It does take some time, and you can take steps while it happens to make sure you can land your aircraft and live to fight another day.

Further

Carrying the metaphor even further, what else can you learn from the SWA Flight 1380 ordeal?

  • Don’t Sit in the Window Seat:  This is not at all a criticism of poor Ms. Riordan.  She did not do anything wrong.  However, the window passenger is the first to get sucked out if the window blows out.  Metaphorically, don’t position your portfolio to get sucked out if something really bad happens.  For instance, don’t put all of your savings into the stock of one company.  What if you wake up one day and you find out that company was a fraud, or did something illegal?  I guess Enron comes to mind, as does Madoff.  Don’t be 100% leveraged to one company.  Diversify among asset classes and among brokerage and bank accounts.
  • Keep your Seat Buckled:  Ms. Riordan was buckled in but she got sucked out anyhow.  If you and your portfolio are “buckled in”, along for the ride and on the journey for the long haul, you will be better able to ride out turbulence, even turbulence that claims some victims.
  • Fly with an Experienced Pilot:  An experienced financial advisor that has been through turbulence and knows what to do when you hit a few bumps can help guide you to land safely.  If for no reason other than to get a second opinion as to your potential vulnerability in the event of rapid decompression in the markets, do yourself and your portfolio a favor and contact me or your trusted advisor.  It will help you with your peace of mind.

Paying Down Debt = Buying Bonds

Financial planners like to put clients into investment portfolios that are neatly boxed in, such as 60% stocks and 40% bonds, or 70%/30%.  In my opinion, such a portfolio split is ok only after all of the client’s debt is paid off.  At least, all non-mortgage debt should be paid off prior to investing in any bonds, and even then it is debatable as to whether it makes sense to invest in bonds.

Spread

Mortgages now are in the 4%-range, as are perhaps car loans.  Student debt is now in the 8% range.  Credit card debt is in the high-teens.  Why would you invest in say a bond fund that pays 5% while at the same time you have a mortgage, student loan debt, a car loan, and maybe even unpaid credit card balances?  It doesn’t make economic sense.  Banks make money on their “spread”, which is the difference between what they earn on loans and what they have to pay to depositors.  If you have unpaid loan balances, you probably have a negative spread, meaning that you are borrowing money at a higher rate than what you are earning by lending it out.  Investing in bonds is equivalent to lending money to the party from whom you are buying the bonds, including the US Government if you are buying US Treasury Securities.  No bank would stay in business if it lent at a higher rate than that at which it borrowed.  You shouldn’t, either.

Mortgages

Mortgages are somewhat different because individuals can deduct the mortgage interest on their taxes.  However, the new 2018 tax law will increase the Standard Deduction to $24,000 for Married Filing Jointly, which means that, unless your itemized deductions (including mortgage and all other itemized deductions) exceed $24,000, then it is unlikely you will opt to deduct your mortgage interest.  The new tax law also reduces the amount of mortgage that can be deducted from $1 Million to $750,000.  The point is that the tax favorability of mortgage interest is reduced starting in 2018.  So, in my opinion, it is a push as to whether it makes sense to buy a bond fund or pay off or pay down your mortgage.  The money in and the money out will be about the same even after taxes.

Less Current Income Needed

In addition to portfolio balance and risk mitigation, another important reason why investors buy bonds or other debt instruments is for current income.  They need the incoming interest payments to live on.  If you pay down debt, you reduce your burn rate, meaning that you will need less income from the bonds that you are buying.  By reducing your monthly outflow, you will accomplish the same goal of balancing your income and expenses at the end of each month as you would have had you kept your outflow the same and increased the amount of your inflow.  It is easier and makes more sense just to reduce your outflow by paying down your debt burden.

IMO

It is a different story in your retirement account because you can’t use retirement account money to pay off debt.  Do the 70%/30% allocation split in your 401k.  However, if you are sitting there with a mortgage, car loan, student loan, or especially credit card outstanding balances, do yourself a favor that makes complete financial sense and use any excess investment money that you were thinking about allocating to a bond fund and instead allocate it toward paying down those loan balances.  Also:  Pay down the loan balance with the highest interest rate first.  This may be the subject of another blog post.

Copy The Pros

My father thought he could improve his golf game by watching closely other good golfers at his club and copying swing tendencies he thought were good.  For instance, one golfer had a slight hesitation at the top of his backswing before starting his downswing, so my father copied that move.  Did it work for my father?  Sometimes, but that’s not the point.  The point is, my father tried to emulate those that were better than him.  There is a lesson there for your financial planning.

This article shows that, the wealthier you become, the more you tend to pay down debt rather than accumulate more assets.  Maybe it is time for you to start doing the same!  If you aren’t already doing so, use any extra money you come into to pay down debt rather than to buy something else.  Save more, spend less.

The Millionaire Next Door

Twenty-two years ago in 1996 Thomas Stanley and William Danko published “The Millionaire Next Door“.  In it, they describe habits and tendencies of wealthy people from all walks of life, and who mostly live in blue-collar neighborhoods.  Some of the common traits among wealthy people (which they call Prodigious Accumulators of Wealth) were as follows:

  • Spend less than you earn
  • Don’t buy too expensive of a house.
  • Don’t go into debt
  • Buy a used car, and buy it by the pound:  Don’t buy an expensive small sports car
  • Don’t try to Keep Up with the Joneses
  • Take a financial or investment risk only if the odds are in your favor
  • Don’t bail out your own deadbeat children

Stanley and Danko’s point was the same:  If you emulate those that are already wealthy, you are more likely to become wealthy yourself.

Find Someone to Copy

If you are not where you want to be financially or in life, or if you just want to improve your current position, instead of inward soul searching, just go out and find someone who is successful at what you want to do and copy what that person is doing.  Your role model can be someone famous or they can be someone in your own family or neighborhood.  They can be world-renowned for what they do or just good in your own opinion.  You can talk to your role model before setting about to change your life, or you can just wake up one morning and set to the task.   You don’t need to copy everything the role model does, just those things that make your role model successful.  Tweak it so that it works for you.

A Good Financial Planner

If you are still struggling to find a role model, especially in your financial life, I would be glad to provide assistance.  Though I am not holding myself out there as a role model, I can help you come up with a plan that will help you get you to where you want to be, and I can provide examples of people who are successful in getting their financial lives in order.  For some people, working with another person, a qualified, caring financial planner, is the only way they are able to understand their financial goals and get the help they need to get there.


Duration for Stocks

As I wrote in my previous post, Duration risk is the price risk sensitivity of a bond due to changes in market interest rates.  What about dividend-paying stocks?  Do they also have Duration risk?  There have been many academic studies about this, and the conclusion is that dividend stocks do exhibit price risk similar to Duration risk in bonds.

Higher Dividend = Higher Duration Risk

This study by a couple of doctoral students concludes that stocks that pay a higher dividend exhibit traits that are consistent with a higher Duration risk.  I use Finviz.com, a free stock charting site that also has a Screener function.  With Finviz.com, you can screen for stocks that pay a dividend of 4% or over, for instance.  (The dividend percentage is the last dividend paid per share divided by the current stock price).  You can input other parameters as well, such as sector or market capitalization.  In doing this, you can find stocks that pay 7%, 8% or even more.

There are stocks wherein dividends amount to the bulk of the total return you expect from investing in that stock, and there are other stocks wherein you invest hoping for price appreciation, and, oh, by the way, the company also pays dividends.  Utility companies are examples of the former – stocks that pay relatively large dividends – and Microsoft is an example of the latter – growth stocks that also pay dividends.  If interest rates go up or are expected to go up, you would expect that utility stocks would get hurt more than would Microsoft, because the dividend is so important to the total return to the utility stock investor.  Thus, you could say that stocks that pay a higher dividend, or for which the dividend is more important, have more Duration risk than does a Microsoft, even though Microsoft’s current dividend rate is no small change at 1.86%.

Back to my Finviz.com example, when I do my screen for higher dividend stocks, and then sort by dividend yield, I would expect that the highest dividend-paying companies (in terms of dividend yield) would have more Duration risk than do the companies lower on the list.

Again, Why Should I Care?

This is important to you if you are seeking a higher yield and investing in dividend stocks as an alternative to traditional bonds or other fixed-income.  Just because you are investing in stocks instead of bonds doesn’t mean that you are avoiding Duration risk.  Dividend-paying stock prices are at risk if interest rates are seen to be on the uptrend, as they are now.  Indeed, the Dow Jones Utility Index declined about 15% from early December 2017 through early February 2018, as interest rates ticked up.  This is a real-life example of Duration risk in stocks.

Oil Stocks

Many of the large oil companies – the Exxons, Chevrons, Shells and the like – pay strong dividends, sometimes in the 4% to 5%-range.  I don’t think these companies contain as much Duration risk as do other pure-dividend plays such as utilities and real estate investment trusts.  The reason is that the companies themselves have opportunities for growth over and above what is offered through the dividend.  Put another way, investors invest in Big Oil possibly for dividends but more so for the potential growth in the oil business.  This is just my observation, not through the aforementioned study by the doctoral students.

IMO

My point is to give you another way of looking at dividend stocks and the inherent risks therein.  If you are “reaching” for a dividend by investing in a company that pays a very high dividend, you must be aware that your investment is subject to Duration risk through a decline in price as interest rates rise.  Lastly, I am not forecasting a rise in interest rates, but others are and the market narrative is that rates will rise.  Let’s see how it plays out.  Again, contact me if you want to explore this futher.

Duration for Dummies

If you ever find yourself in a conversation with a fixed income or bond manager and you want to sound sophisticated and bring up a topic near and dear to their heart, bring up the topic of Duration.  Before you do that, it is best that you at least know some of the basics of a subject.  Read on.

Fulcrum

Duration is very important to bond managers, and it should be to you as well.  Duration is the sensitivity of the price of a bond to changes in interest rates.  It is different than Term or Maturity.  If you buy a 10-year bond that yields 4% and you hold it for the entire 10 years, you will get all of your money back plus the 4% per year of interest.  However, if you want to sell the bond prior to Year 10 and interest rates have risen in the meantime, you will not be able to sell your bond for 100 cents on the dollar.  You will sell it for fewer than 100 cents because whoever buys the bond will want to earn the higher interest rate.  That is Duration risk – the possibility that you won’t get 100 cents on the dollar for your bond if interest rates rise during your holding period.

Duration is expressed in a number of years, and the number of years is almost always fewer than the term of the bond.  One of my professors once described Duration as the following:  Picture a golf club, probably a driver.  Now try to balance the club using one finger, so that the club is balanced horizontally.  The point on the club where your finger touches the club, the fulcrum, is the Duration.  Because the club head side is heavier than the grip side, that point will not be at the midpoint of the club.  Instead, that point will be toward the club head end of the club.  Same with Duration – because your cash flow is skewed toward the end of the term, which is when you get your principal back, the Duration of a bond will be closer to the end of the term of the bond than the beginning.

Why Does Duration Matter?

Bonds with longer Duration are more price sensitive to changes in interest rates than are bonds with shorter Duration.  It makes sense if you think about it.  At one extreme, a portfolio of 30-year fixed-rate mortgages are more price sensitive and therefore have more Duration risk than does a portfolio of 3-month Treasury Bills.  Because the coupon rate on the 30-year mortgages can only change every 30 years, the price an investor is willing to pay for that portfolio of mortgages can move up and down significantly as market interest rates change.  For the 3-year Treasury Bills, the price risk is not nearly as great because the T-Bills will mature in 3 months so you can then buy new 3-month T-Bills yielding whatever the market rate is at that time.

So, Duration matters to you and your portfolio because, if your Fixed Income or Bond portfolio has a longer Duration, its price may vary as market interest rates change.  How do you know if your bond portfolio has a longer Duration?  If you have an IRA or 401k, your Fixed Income portion is probably in a “Bond Fund”.  Unless your Bond Fund explicitly states that it is a “Short Duration Bond Fund”, your Bond Fund is probably a longer Duration fund and is therefore more subject to Duration risk.  If you own individual corporate bonds, you also likely have Duration risk.  The shorter your term to maturity, the less will be your Duration risk.

IMO

Duration risk is not a bad thing, but it is something you should be familiar with.  If you are a long-term investor with Bond Fund holdings in your 401k, you might not be as concerned with Duration risk right now.  However, if you are near retirement and might need your money sooner rather than later, you want to make sure any bond holdings you have are shorter-term and not as subject to Duration risk.  If you are retiring in 3 years but your bonds mature in 10 years, you might want to think about reallocating to shorter bonds.  Most economists predict rates are going upward, which means prices for bonds that are already issued will be moving correspondingly downward, meaning you may not get your 100 cents on the dollar for your 10-year bonds if you need them in 3 years.  If you need help figuring this all out, please contact me!

Amazon

Amazon has been taking it on the chin lately, mostly because of negative publicity from our Tweeter In Chief.  From its high of about $1,610 per share in mid-March, AMZN drew down about 16%, and it may not be finished with its drawdown.  Investors are concerned that the negative publicity could lead to increased regulatory scrutiny.  More government scrutiny is not good for business.

Traditional Retail

One of President Trump’s criticisms of Amazon is that it is hurting “traditional retail”.   I don’t think this is arguable.  I also think Wal-Mart has done more to hurt traditional retail than has Amazon.  I’m sure I am like a lot of people who enjoy strolling around a pedestrian retail area looking at all of the stuff for sale in all of the stores.  The key word is “looking”.  That means not buying.  Smaller boutique stores have a difficult time competing against big retailers and against Amazon.  However, if you want smaller boutiques and pedestrian retail areas to survive, you need to support them by buying stuff from them.  It is in all of our collective hands to keep these parts of our culture in business.

Progress?

I am not a Retail expert.  I am not as familiar as many others with the metrics of what makes a good retailer these days.  This article in the Wall Street Journal equates Amazon with “progress”.   Progress from what?  When you want to go for a walk, maybe to look at Christmas decorations and do some shopping for your family, do you go to an Amazon warehouse?  Even a mall, for all of its shortcomings (all the same stores, crowded, no parking, all indoors), at least provides a sense of community.  There are progressive elements to Amazon – more inventory, delivers to your house, easy payment – but Amazon does not contribute to the sense of community.

IMO

I don’t think there is enough animosity out there against Amazon that it will lead to significantly more governmental scrutiny.  I do think people need to support their community by buying stuff at their local businesses.  I am not at all critical of Amazon and I certainly don’t think they deserve additional attention from the government.  I buy a lot of stuff from Amazon, but I could buy more, such as all of my groceries.  I still enjoy “going to the store” and I know that if there is going to be a store to go to, the store must make a profit on stuff that I buy there.  Maybe the Millennial Generation is different, but I doubt they will be as they get older.

Copper vs. Gold

Copper and Gold are both metals that are mined from the Earth, yet they have very different and sometimes opposite associations.  Copper is associated with economic growth and Gold is associated with safety.  Copper’s price increases when it is perceived the world is in a growth phase and Gold does well during periods of uncertainty.  The ratio of the price of Copper to the price of Gold is also informative – a higher ratio means investors see more opportunity for growth than there is uncertainty.

Copper

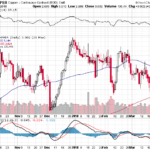
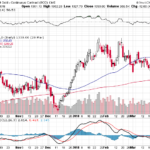
Copper is a proxy for growth because nearly all electrical wiring and some plumbing are made out of copper.  Copper’s worth is in what its uses are.  Copper isn’t just used in commercial and residential real estate and construction.  According to this article, a new electric car is wired with 150 pounds worth of copper, which is 3 times more Copper than is in a traditional car.   The article goes on to say that the International Copper Association predicts a tenfold increase in Copper demand for use in electric vehicles by 2027.  If you believe in the growth of electric vehicles but perhaps aren’t sold on Tesla, then buying Copper is a way to play your belief.  Another play is that the supposed new infrastructure spending bill will also be bullish for Copper.obal gr  The current price is Copper is $3.00 per pound, which is about $0.30 lower than the high of $3.30 reached in December 2017.  The 10% reduction in value somewhat mirrors the reduction in the stock market since late January 2018.  $3.00 is an important number because at that level or above it can be profitable for miners to start new copper mines.


Gold

It is said the Gold has intrinsic value.  Lustrous, shiny, beautiful to look at in and of itself, Gold’s value isn’t what it is used for, but what it is.  Because of its intrinsic value, Gold has forever been a safe haven for investors during times of crisis, geopolitical or otherwise.  Copper isn’t safely secured under armed guard at Fort Knox.  Pioneers didn’t head to California in 1849 in search of Copper.  My recommendation is that all investors should own some gold.  Just in case.

As the chart shows, after bottoming at about $1,240 per ounce in early December 2017, Gold rose to about $1,355 in January 2018 and has since been trading in a range of roughly $1,355 on the top to about $1,310 on the bottom.  Interestingly, Gold went down a bit in early February 2018, when the stock market corrected 10%.  The narrative was that stock correction was because of heightened inflation fears.  If Gold is an inflation hedge, it didn’t really act like it during the February correction.


Copper to Gold Ratio

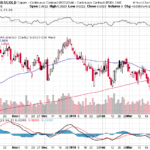
If Copper is about growth and Gold is about safety, then a rising Copper/Gold ratio would indicate future growth and a falling ratio would indicate future uncertainty, or that the growth picture growing forward isn’t as rosy.  As you can see from the chart, the ratio has been falling slightly since making a high in very late December 2017.  The chart is somewhat misleading because of the scale.  The highest the ratio got in December was 0.0025, and it is currently at 0.0023 after hitting 0.0022 late last week.  So the increments on the chart are very small, but the trend is telling.  The trend in the ratio is another way to show that investors are feeling less gung-ho than they did in January.  One take that I have is that the ratio was declining throughout January, which could mean it foretold the stock market correction in February.

IMO

So, are you a Copper person or a Gold person?  Do you believe in the global growth story (Copper), or are you skeptical that growth will materialize and that the world economy will be more sluggish than robust (Gold)?  One disclaimer is that everyone is a Gold person at some level because of its intrinsic value.  I think the most telling is the ratio between the two.  Right now I see the ratio as technically oversold and likely to correct upwards, meaning either Copper will go up or Gold will go down or both.  Clearly, the “Gold” people have been winning this year so far and that has had major ramifications in the stock market.

The charts are from StockCharts.com, which is a free service.  To get the quote for Gold, type in $Gold, and the same thing for Copper.  StockCharts is very good – you get more than you pay for.

VIX – Part II

My first blog post on June 21, 2017, was about the VIX, otherwise known as the Fear Index.  At that time and for the remainder of 2017, there wasn’t much life to the VIX index because market volatility was dormant.  Since February 1, 2018, however, volatility has returned and the VIX is topical again.  As I write this, the VIX is at 20.45, up from just under 10 in January 2018.  What is the VIX;  What does VIX at 20.45 mean;  How can or should an investor use the VIX in their portfolio.  Parts of this blog post are taken from my 6/21/17 post but with updated numbers.


What is the VIX?

VIX is an index sponsored by the Chicago Board Options Exchange (CBOE).  It is an up to the minute reflection of option premiums on the S&P 500 Index Futures.  Option premiums are a function of the volatility of the underlying security – the more volatile, and higher the option premium.  Thus, the VIX is a reflection of volatility in the market for S&P 500 Index Futures.  The media has taken to calling the VIX the “Fear Index” because the VIX tends to rise when the S&P 500 index falls.  The VIX is forward-looking insofar as it is based on option premiums in the next 30 days.  The VIX is not a creamy menthol substance that you rub on your chest or head to relieve congestion.  

What does the VIX value mean?

VIX is expressed as the expected 1 standard deviation of returns of the S&P 500 Index for the next year.  1 standard deviation means there is a 68% probability of an event happening.  VIX at 20.45 means that, based on options premiums, the market projects there is a 68% probability that the S&P 500 will be within a range of up or down 20.45% from its current level over the next year.  Mathematically, to convert this to a monthly projection, divide the index by the square root of 12 (3.46), meaning the projected 1 standard deviation of volatility for the S&P 500 is +/- 5.91%.  What do you think – does it seem likely (with 68% probability) that the S&P 500 will be within a range of 5.91% up or 5.91% down within the next 30 days?  I think it is probably a good guess.

The highest the VIX reached recently was about 38 on Monday, February 5, when the Dow dropped over 1,000 points,  which meant that it predicted that markets would be either up or down about 11% during the ensuing 30 days.  As it turned out, the S&P 500’s lowest point over the next 30 days after 2/5 was 3% lower, and its highest point after 2/5 was about 5% higher.  So the 38 reading was too high, but things looked bad at the time. 

How does the VIX move in relation to the S&P 500?

Usually, they will move in the opposite direction of one another.  And, usually, the VIX will move will be a greater percentage than the S&P 500.  If the S&P 500 goes up 1%, the VIX index usually goes down by more than 1%, and vice versa.  As a result, many investors and funds managers use the VIX as a hedge against long positions in the S&P 500.

Does that mean VIX (or VX or VXX) is a good way to hedge?

Maybe.  VIX can hedge systemic (or system-wide) risk to long positions you have in the S&P 500 index, but it is not a pure hedge to individual stocks.  Moreover, because VX contracts expire every month, VX only works as a hedge for that month – you could purchase later month contracts, but you would pay a premium for doing so.  

Can an investor “own” the VIX Index?

No, but they can own a couple of proxies, one that I believe is better than the other.  The better is the VIX Future (VX), traded on the Globex Futures exchange.  The VX is a Futures contract that expires every month.  For that reason, my recommendation is to use the VX to hedge positions for not longer than 1 month.  The not-as-good proxy for the VIX Index is an exchange-traded fund with the symbol VXX.  I believe the VXX is not as good because its managers trade the VX, so an investor who owns VXX indirectly owns the VX Futures subject to the direction of the VXX managers, so owning the VX Futures is the better, more direct play for investors.

Is VIX too high or too low?

By answering this question, you are offering an opinion as to what you think others are thinking.  If you say VIX is too high, then you are saying the traders who invest in S&P 500 options are too skittish, not complacent enough, or not comfortable with Pax Oeconomia.  You are saying the economy going forward will be, if not robust, then at least very smooth and predictable.  If, on the other hand, you say VIX is too low, then you saying those S&P 500 options traders are too complacent, that they are maybe too young to remember the turmoil of the recent past (such as 2008 or August 2015), or that they need to remove their rose-colored glasses.  Also, remember that the VIX looks out for only 30 days, so that is the time frame to keep in mind for its predictive value.

IMO (In My Opinion – A Feature of All of my Blog Postings)

Back in June 2017, I wrote that I thought the VIX (at about 11 at that time) did not reflect enough risk in the markets.  I was right, but it took until February 2018 for the volatility to increase, meaning that the VIX at 11 was, if anything, too high for what transpired for the ensuing 30 days.  Now, at 20.45, I think the VIX is probably too high, meaning I don’t foresee an almost-6% change in the S&P 500 in the next 30 days.  The news that has tanked the market during the markets since February – higher interest rates and a trade war – are unlikely to exceed expectations that are currently already baked into the markets.  Time will tell.

Lastly, I believe there are better hedges for your long positions than just owning VIX proxies:   

  1. Always maintain a balanced portfolio that includes a diversified portfolio of equities, fixed income, and alternative assets such as commodity/futures funds; and
  2. Unless you devote much of your personal time to keeping track of the markets, you should have a manager who does constantly watch the markets and who will re-allocate your assets in the event of a major market correction.