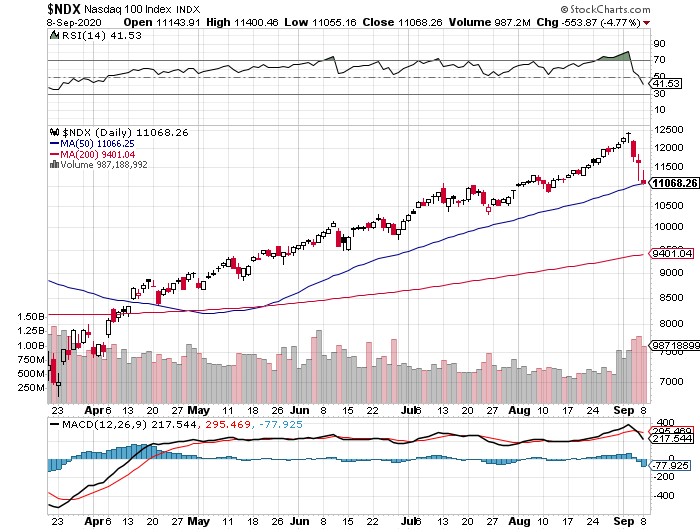
I have noticed recently that the daily performance of the S&P 500 Index and the Nasdaq 100 Index have not always been consistent with one another. This is probably due to the evolution of the Covid economy in the US. Since the onset of Covid, the Nasdaq 100 has outperformed the S&P 500 because more of the “stay at home” or “work at home” stocks are in the Nasdaq 100. During the past month, however, the S&P 500 has outperformed on some days on the hope that some industrial, financial and retail sectors are about to reawaken as Covid restrictions are loosened. To test my hypothesis, I went to a site I have used in the past: etfscreen.com. I found that the correlation coefficient between the two etf’s that represent the respective indexes – SPY for the S&P 500 and QQQ for the Nasdaq 100 – is 0.90. This is high, meaning that my hypothesis that the two etf’s could represent hedges against one another is not valid.

Correlation
Correlation is a calculation that determines the returns of securities over time relative to the returns of different securities over the same time. To do the calculation involves calculus – go ahead and Google “Correlation Coefficient” if you want to see the equation. A correlation coefficient of 1.0 means the returns of the two securities that you are testing are perfectly correlated, and a coefficient of 0.0 means the two’s returns are not correlated at all. Correlation coefficient sounds a lot like Beta, perhaps because the values are typically between 0 and 1. However, whereas correlation is about how two different securities perform relative only to one another, beta is about how one security’s volatility relative to the entire rest of the market, so correlation and beta represent different concepts.
A Handy Tool
The purpose of my post today, however, is to encourage you to use the same tool that I used to calculate how well your portfolio of etf’s are correlated. The website etfscreen.com can do the calculation for you. Once on the website, click Tools, and then Correlation Data. You will see a chart with the correlation data of some of the most actively-traded etf’s, including SPY and QQQ. There is an entry field right below the chart. In the entry field, you can customize the chart by entering the ticker symbols for etf’s that you want to explore. Hit Enter, and it will calculate the correlation coefficients for your portfolio of etf’s. Unfortunately, this will not work for individual stocks or mutual funds; only for etf’s. However, if you are curious how one sector of the economy is performing relative to another sector, use the etfscreen.com website to find sector index etf’s that represent the sectors that you are curious about (unless you already know those ticker symbols), plug them into this Correlation calculator tool, and it will calculate the coefficients. For instance, are you curious how the financial sector performs relative to the consumer discretionary sector? Plug the Vanguard Financial Sector ETF (VFH) and the Vanguard Consumer Discretionary ETF (VCR) into the chart and it calculates their correlation coefficient to be 0.79 – pretty high, but not perfectly correlated.
Why Is This Important?
Knowing the correlation coefficients of various investments within your portfolio is important because of diversity. Not “diversity” in the current sense of gender, race, or identity. Rather, diversity of returns. If one sector of the economy surges ahead, will another sector likely follow, and to what extent? You should seek a portfolio that is diverse from the standpoint of asset class as well as diversity of returns. Different asset classes should have different return prospects, but not always and not entirely. Similarly, you may have different assets within the same class of assets (i.e., stocks or etf’s), but because they may have low correlation coefficients, you may have a portfolio that is relatively diverse. A rising tide doesn’t necessarily lift all boats at the same time, to twist an old saying.
IMO
ETFScreen.com’s correlation data tool is very helpful and one you should use if you want to see how diverse your portfolio really is, even if you are invested in a limited number of distinct asset classes. Though this particular site is only helpful with respect to etf’s, because there are so many etf’s available, it can give you a good idea of what returns to expect across the spectrum of sectors out there.


