The Powell Put

I am writing this on the afternoon of November 20, 2018.  The stock market is really bad.  Apple, Inc., the star of the show, lost almost 5% of its value today and is now at $177 and in Bear Territory, down about 23% from its high of just over $230.  The Nasdaq 100 Index likewise is down 15% from its high, reached just 8 weeks ago.  Tech is getting wrecked.  Crude Oil declined for 10 straight days earlier this month, recovered a bit, but fell today by almost 7% to its lowest price in a year, dragging energy-related stocks along with it.  Non-Tech and non-energy related stocks are also getting hit:  The S&P 500 is down 10%.  The meme out there is that investors are concerned about future economic growth, trade uncertainty, and interest rates.  Is the shoe dropping?  
2/10 Spread

Another way that looming troubles manifest themselves is in the bond market.  The Federal Reserve has been raising short-term rates for a couple of years, and have raised the Fed Funds rate about 225 basis points, or 2.25%.  The problem is that longer-term rates have not risen commensurate with short-term rates.  As a result, the spread between the 2 year and 10 year US Treasury yields has narrowed again in recent days.  According to Bloomberg, the current spread is only 26 basis points (2.80% for the 2-Year and 3.06% for the 10-Year).  This is 3 basis points narrower than it was 1 month ago, and lower by 13 basis points for the 10-Year yield.  Investors are selling stock and buying these US Treasury bonds, forcing prices up and yields down.  

Tone-Deaf Fed

The Fed, particularly Fed Chief Jerome Powell, is catching heat in the media for its “tone-deaf” statement coming out of its most recent meeting a couple of weeks ago.  Powell’s statement was to the effect that the economy is rosy and there is no reason to re-visit the current policy of raising interest rates.   Another Fed rate hike in December seems to be highly likely.  The criticism is that things really aren’t that rosy, particularly in other parts of the world, and that corporate inventory build-up and other factors are pointing to an increased threat of recession that the Fed seems oblivious to.

The Powell Put

I believe these stock and bond market changes will cause the Fed to change its tune somewhat when it meets in December.  I believe the Fed will raise rates in December but will state that it will re-look at any future rate raises as economic data becomes available.  The Fed never reverses course:  It will pause whatever it is doing, take a look around, and then decide to move forward or backward.  The Fed is a supertanker, a large entity that is piloted slowly, but with huge ramifications.  When (and if) the Fed and Chairman Powell state that they are no longer planning to increase rates further, the stock and bond markets will rejoice.  That doesn’t mean things are going straight up after that, but changing a future pattern of rising interest rates would take away one big fear that investors currently have.  This is the “Powell Put”:  that the Fed will say they will no longer increase rates, causing an end to the downside in stock prices.  At least that’s what stock investors hope will happen.

IMO

This doesn’t mean that I think you should buy stocks now.  The knife could fall further between now and mid-December when the Fed meets again, and the Fed might not say what I think they will.  Also, as you know, my advice is worth what you pay for it.  Nevertheless, I have written before that the Fed will not continue to raise rates into an inverted yield curve and a recession, and I think we are approaching an inflection point now and that the Fed will stop, look around, and change its course on interest rate increases.

3 Reasons To Be Thankful

Happy Thanksgiving!  We usually think about giving thanks for blessings in our personal lives during Thanksgiving, but I think there are some people and situations out there in our financial lives that also need some love this time of the year.  Although I am sure there are more, in the interest of brevity, here are three:

Innovators

Not to sound like an old codger, but the world has changed a lot since I got my start many years ago.  For instance, smartphones have been around en masse only for the past 10-12 years.  Think about how much everyone’s life has been made easier because of smartphones!  Since their introduction, they have become faster and more capable.  Of course there are negatives – poorer interpersonal skills among them.  However, they have made life easier.  In developing countries, cellphones have leapfrogged land lines, which in many cases hadn’t even been put in yet.  Think about the advancement in the lives of people living in underdeveloped situations when they get and can use a smartphone!  It takes innovators to design and build smartphones, just as it takes innovators to design and build all of the component parts of smartphones.  Also, think about the health care sector and all of the innovations that have made life easier, and hopefully will continue to make life easier over time.  Think of laser and robotic surgery or new immunotherapy medications for cancer.  You can get an EKG now on the spot using your smartphone.  None of this would be possible without the innovators who had the vision (and of course the profit motive) to bring their ideas to fruition.  Be thankful for innovators – for the most part, they make lives easier!

Deregulation

Now we think nothing of logging into our investment accounts and making trades online right then and there.  This wasn’t always the case.  Not too many years ago, you could only trade by calling your broker and telling them what you want to do, and you would pay a commission that was spelled out by SEC regulations.  In the past 40 years, this has all changed, and none of what you see now in the financial markets would have been possible without the deregulation of markets, how stocks are traded, and the costs of doing trades.  Index ETF’s would not have been possible without deregulation.  Your ability to monitor your account on a daily or even real-time basis is due to deregulation of markets.  Commissions have gone from relatively high to almost non-existent.  The result has been the democritization of financial markets.  Everyone plays the game in real time, even when they are away from their office and through their smartphones.  Think about a different sector:  airline travel.  Over the last 40 years, deregulation of routes and fares have resulted in an explosion in airline travel.  You could argue that the system is overloaded and that it has gone too far, but deregulation has helped to make air travel possible and affordable for a large segment of the population that wasn’t previously able to travel.  Politicians and a lot of the media are currently discussing increased regulation of social media and other tech sectors.  I think regulation would be the wrong way to go.  It takes time – years – for markets to sort things out, but free markets do a far better job of regulating than artificial government-imposed regulations.  Be thankful for deregulation!

Value Investors

This may seem odd to you, but old-fashioned value investors are the backbone of the stock market.  You couldn’t have Index ETF’s without value investors.  Why?  Because value investors, and moreover those who buy and hold individual stocks, keep the management of companies in line and immediately answerable to the stockholders.  Think of General Electric, whose stock has fallen like a rock since 1/1/2017.  GE’s demise would not have happened without individual stock owners voting with their feet by selling their GE stock.  They were telling GE management at the time that they don’t like the way the company is being managed.  So, GE now has new management.  GE has continued to drop since the new CEO was named, but GE is heading in a different direction that will take time but that is more likely to succeed than was previous management.  If all stocks were held through index funds and not through individual stockholders, as strange as that sounds, none of this transformation of GE would have happened.  Thank you to value investors and individual stockholders who are keeping management’s feet to the fire!  Without you, the rest of us who own funds would be lost at sea.

Happy Thanksgiving To All!

Monte Carlo Analysis

One technique that financial planners use is a Monte Carlo analysis.  Named after the famous European casino, the Monte Carlo analysis is an attempt to project what will happen in the future given a whole list of variables that might affect the outcome of an event.  Financial planners use a Monte Carlo analysis to attempt to answer the question, “What is the probability that this client will have enough money to live comfortably during retirement?” 

Fixed Point

To do a Monte Carlo analysis, start with a fixed point in time – usually the present time.  Add variables, including but not limited to the following:

  • Total dollar amount of assets
  • Mix of assets
  • Future performance of each individual investment
  • Age of the client now and age of proposed retirement
  • Number of dependents
  • Health of the dependent and health care spending requirements

As you can imagine, these are all huge life-varying assumptions that can flow in any number of different ways.  That’s why we need the power of modern computing to make some sense of it all.  Monte Carlo analysis would not be possible without computers and software.

Plot

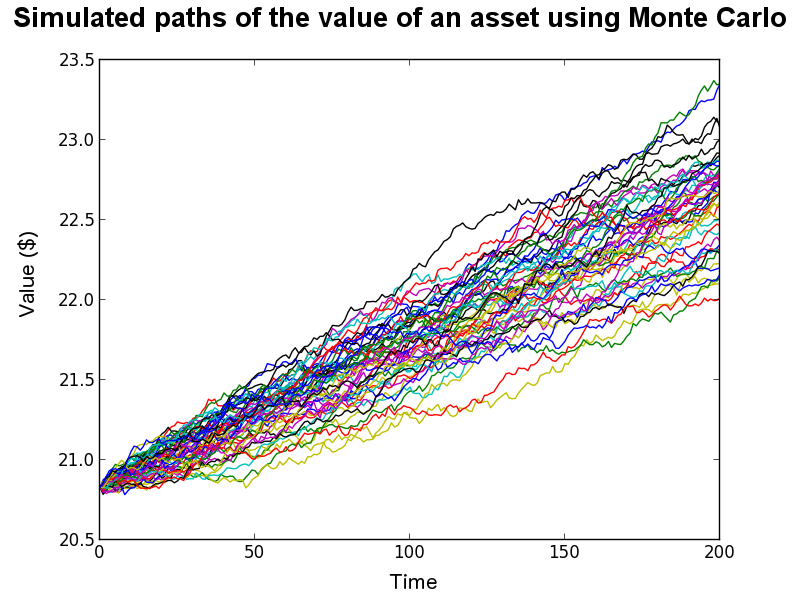
When the assumptions are all input, the software pings all of these assumptions off of one another and spits out a chart that looks like a spaghetti chart.  In fact, the spaghetti chart that hurricane forecasters display is a type of Monte Carlo analysis.  Here is an example of a Monte Carlo chart:

Monte Carlo Analysis Plot

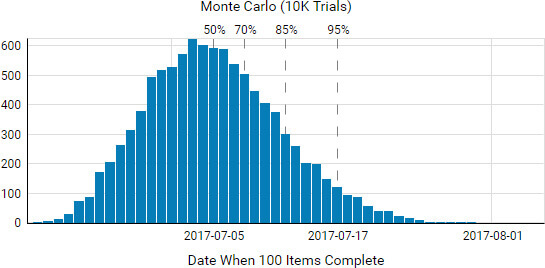
Each line on the plot represents a potential outcome given the input factors.  As you can see, most of the colored lines are bunched in the middle.  That phenomenon gives rise to the second aspect of Monte Carlo analysis, which is the standard distribution analysis, which looks like this:

Bell Curve

This chart is a fairly standard Bell Curve chart.  From this, the planner can determine what is the most likely outcome, and what outcomes are likely within 1-2 standard deviations of the mean, or most likely.  At the end of the analysis, the planner would like to say something like, with 95% probability, this client will be able to retire comfortably if they continue to do the following list of behaviors that they need to do to ensure that 95% probability.  Thus the Monte Carlo simulation can act as a guide for how the client needs to live their life going forward if they want to achieve their financial goals.

Software

There are a number of software packages out there that financial planners use to perform Monte Carlo analysis, including Money Guide Pro and eMoney Advisor, among many others.  Each planner has their own favorite.  All have advantages and disadvantages.  You can even do it yourself for free using Excel and add-on software you can download.  Just Google it and find out.  As with anything else, you get what you pay for, and remember GIGO (garbage in, garbage out).  It’s best to pay for a financial planner and use their state of the art software.

IMO

Just be aware that Monte Carlo analysis is a common tool for financial planners and one that you can avail yourself of if you contact me or your current planner.  It can help you make decisions going forward and it can help you see how you are doing versus how you thought you might do when you made the plan.  Elections, sports, investing, weather – all activities are moving in the direction of analytics and probability and Monte Carlo analysis will also move you in that direction.  Welcome to the 21st Century!

Leading Indicator

For economists, stock prices are considered to be a Leading Indicator, meaning that if stock price movements are bullish, this tends to bode well for the (short-term) future of the economy, and vice versa.  This status as a leading indicator is bearing out during this current quarterly earning cycle, as can be witnessed by how stocks have been moving after earnings announcements.  Whereas during the 1st and 2nd quarter earnings season stocks tended to go up upon reporting an earnings “beat”, during the 3rd quarter stocks have been getting hit even if a “beat” was reported because investors are concerned that future earnings won’t be as robust.

Pay Attention To the Future

3rd Quarter Earnings

Here during November, we are in the midst of companies reporting their (calendar) 3rd Quarter earnings.  According to FactSet, as of October 26, 2018, “77% of S&P 500 companies have reported a positive earnings surprise and 59% have reported a positive sales surprise.”  That sounds good.  However, what has happened in the stock market?  The S&P 500 went down 6.9% during October.  Doesn’t seem to match with the level of positive earnings surprise, does it?  Contrast that with July, the first month after 2nd Quarter earnings:  The S&P 500 gained over 3% during July 2018.  Why was October so bad when July was so good?  Because investors are now more pessimistic about future corporate earnings potential.  

The Future

This is why stock prices are a leading indicator:  because investors (in general) look to future earnings, not past earnings.  Past earnings are a great way to gain an understanding for how well the company is managed, but if you are looking at buying today, it is the future you should be concerned with.  Stock prices, it is said, are a discounted present value of future cash flows.  If investors think the future outlook is about to change, they will (collectively) hammer the stock by selling it and hoping whoever buys it has a rosier outlook for the future of the company.  

IMO

While it is nice to hear how well companies did last quarter when they report earnings, it is also perhaps more important to understand what these same companies are saying about their future prospects.  Institutional big-money investors certainly are paying attention, as are stock analysts.  In this information age, the ramifications for a downgrade of the future outlook can be rapid and devastating.

Mid-Term Results

The Democrats have won control of the House of Representatives.  The Republicans have added seats to their Senate majority.  President Trump remains for at least 2 more years.  What do I think the ramifications will be?  Not significantly much for companies and the financial markets.  “Gridlock” is the term being used, but I would call it stasis.  I think things will remain as they are for the next 2 years.  A lot of talk on both sides but not much action.  Here is how I think things will transpire for the next 2 years:

No Budget

I doubt there will be an actual budget being passed.  It is highly unlikely both legislative houses will agree to a budget.  This means we will move forward with “continuing resolutions” and increases in the debt ceiling.  This is nothing new – this is how we have operated since at least 2006.  This also means it is unlikely there will be any significant initiatives, such as a re-working of the tax code as we had in 2017.   The Federal deficit will continue to grow.  At some point, it will become too high, but I don’t know when that will be.  We may get there and not know it until we can’t do anything about it.   I believe the corporate tax cuts are safe, which is great news for companies and stocks.

Health Care

If you like your health care now, you will keep it.  If you don’t like your healthcare now, you will keep it.  I don’t see any way how health insurance and healthcare will change for the next 2 years.  Insurance premiums will continue to increase.  The system will continue to be inefficient.  If there are improvements, such as in medical record keeping, it will be because of private sector initiative.  Rising health care costs are bad news for employers – private companies and public sector alike.  

Infrastructure

Some are saying that there could be initiatives to invest in infrastructure.  President Trump ran on this in 2016 and the Democrats always like more spending.  I am very skeptical that a major infrastructure initiative will transpire because it will cost so much money and because we are already running too high of a budget deficit.  Don’t like the deficit?  Then raise taxes, Democrats say.  Not so fast, say Republicans.  I recommend you stay away from infrastructure plays in the stock market.  

Corporate Profits

Corporate profits should remain strong.  They have boomed during the past 2 years, which is why the stock market has increased.  They may not boom as loudly for the next 2 years but they should still be strong.  Due in part to the tight labor market with Unemployment under 4%, wages are increasing, but higher wages are somewhat offset by lower raw materials and energy costs, although those could reverse at any time.  With the federal government in stasis mode, including the tax code, there is nothing major on the horizon to change the arc of corporate performance an profits.  

Bonds

There will certainly be a continued increase supply of US Treasury bonds because of a growing budget deficit.  Yields have risen for the past 2 years and likely will rise more, but it is up to debate how much more the Federal Reserve will increase short-term rates.  Economists like to point to short-term rates equal to the GDP growth rate, and both are probably to meet pretty soon at the 3%-level.  

IMO

The stock market rallied strongly on Wednesday 11/7 after the midterm election.  “Relief Rally” was the term used, but I believe investors see that the good business environment is most likely to continue for the next 2 years.  Stock investors like “certainty”, or at least lack of ambiguity.  I think it is pretty unambiguous that the Federal Government situation will not cause a big change in the US Economy for the next 2 years.

Dave Ramsey Radio Show

Rather than listening to music, I recommend that you listen to the Dave Ramsey Show, which is a radio show about financial planning.  Dave’s show is on the air at various times in various markets, but typically he is on mid-to-late afternoons on AM radio.  Are you at work at that time?  Listen to the podcast of the show at your convenience.

Dave Ramsey

Dave Ramsey is from Tennessee and is a devout Christian.  He had a best-selling book a few years back titled “The Total Money Makeover” that you can purchase on Amazon or maybe check out of your library.

Get Out of Debt

His main message is that individual debt is bad.  People should at all costs try to avoid going into debt in the first place and if they are in debt they should make budget cuts in other areas in order to pay off their debt as soon as possible.  Personal unsecured and credit card debt is the worst, but going into debt to buy an expensive car is a bad idea, as is too much student loan debt.  The opportunities out there to go into debt these days are abundant and Dave Ramsey says Don’t Do It.  Don’t spend what you don’t have, and if you are already in a hole, dig yourself out of it.  It seems like easy, basic advice, but apparently, too many people don’t heed it.  

Technical Controversy

Dave says that if you have different sources of debt such as a student loan, a car loan and a credit card loan, you should make extra principal payments to pay off the one with the lowest balance first while making minimum payments on the others.  Then, once the smallest is paid off, don’t cut the total amount you are paying toward debt principal, and instead, take what you were paying on the loan that is now paid off and devote it all toward paying off the 2nd lowest balance loan.  Dave’s loan payoff process is called the Debt Snowball method.  Do all of this until your debt is all paid off.  This is controversial among financial planners because it may be better to pay off the loan with the highest interest rate first, regardless of its balance, and then continue to the next highest rate loan.  This more traditional approach is called the Debt Ladder method.  Dave says Snowball works better than Ladder because the debtor will more quickly see the results of their payoff method, and because dollars are more quickly allocated toward paying off the second tier of debt.  

ETFs

Dave is a big proponent of stock ETF’s and that investors should keep the bulk of their money in stocks instead of bonds because investors will need their money to last for longer than they think they do.  Being more in stocks and less in bonds also allows investors to pull more of their savings principal out each year of retirement, a plan that Dave advocates.

IMO

While you may not agree with everything Dave Ramsey espouses, it is nevertheless good practice to listen in from time to time.  Better that then learning what the new musical hits are.  It’s a better use of your time.  Listen to the advice that Dave provides to callers and think about if you agree or disagree.  There are many ways to skin a cat (sorry, cat lovers!).  Dave advocates his ways, mine may be somewhat different, but as long as the cat is skinned at the end of the day and you are satisfied with how you got there, then all is good.

Throwing In The Towel

A friend recently told me he was resigning from a volunteer organization that they had been involved with.  Frustrated by the organization’s unwillingness to adapt and become more user-friendly after months of trying, my friend said he was “throwing in the towel.”

Origin

Throwing In the Towel is a term from boxing.  Back in the day, when a boxer, while still on his feet, was nevertheless hurt and/or clearly beaten, the boxer’s manager would end the fight by throwing a towel into the ring, so that his boxer would avoid further injury and so would live to fight another day.  I saw it happen (on TV) once decades ago but not recently, although I don’t watch much boxing anymore.  Now the term “Tap Out”, from Mixed Martial Arts, has taken its literary place.  Maybe “Tap Out” is the more appropriate phrase because it implies one’s own decision to quit, whereas “Throwing In the Towel” implies someone close to you, or “in your corner”, decides that you should quit.  Either way, you get the picture.

Louis/Schmeling II

Everyone

Everyone has assuredly encountered a situation where you have thought about quitting.  Maybe it was on your 2nd day of Kindergarten, or maybe it was your prior job or prior relationship.  Maybe you are thinking about quitting something or “throwing in the towel” on an investment right now.  It is natural and probably healthy to do so.

How To Decide?

The basis upon which you decide to quit something can be either rational or emotional, and probably will be both – at least there should be some rational component to the decision to quit.  For investing, the more rational the decision, and the more emotions are not part of the decision, the better.  The best thing is to be completely “rules-based” on your decision to quit, or to sell an investment.  For instance, I try to sell an investment if its price falls 7% or more from the price that I paid for it.  The extenuating circumstances don’t matter.  Rules are rules.  Another rule is that I sell when the investment has risen to the “target price” that I set when I bought the investment.  This is the “pigs get fat but hogs get slaughtered” rule. 

Kenny Rogers

There is also the concept of understanding when the odds are in your favor or against you.  This is the “Know When to Hold’Em, Know When to Fold’Em”, Kenny Rogers lyric rule.  Doesn’t matter what you paid for the investment, or whether you have tripped a rules-based circuit breaker.  If the odds are no longer in your favor, Sell right then and there.  How do you know if and when the odds are in your favor?  That is a lifelong quest.


Opportunity Cost

Another factor to consider in deciding to quit:  What is the cost of staying in an investment or any endeavor relative to the opportunity cost of allocating your money or your time to a different investment or endeavor?  Will you earn more money or gain more satisfaction by moving on to something different?  Or will the reward from hard-fought, long term commitment earned by staying in be just that much sweeter? Only you can make that decision, but the concept of Opportunity Cost can at least provide you with a framework for how to make that decision, and inject at least some rationality into the process.

IMO

At a higher level, you can never really “throw in the towel” on your finances any more than you can “throw in the towel” on your life.  All you can do is look at financial planning rationally with your goals and/or wants in mind at all times.  You can exit an individual investment, but you still have to do something with that money after the exit, much as life goes on after you quit your job.  From that standpoint, “throwing in the towel” is really a short-term concept within the continuum of your life.  Tomorrow will be another day, so try as best as you can to be as rational as you can, and rely on rules that you set at the outset.

Series EE Bonds

Series EE Bonds were a thing when I was a child.  Many investors probably don’t know that they still exist, but they do, although you can only buy $10,000 per year (per person) of EE Bonds.  They exist now only in electronic form, and you can buy them only if you set up an account at a government website called treasurydirect.gov.  

Paper EE’s don’t exist any more.  Only electronic.

Double in 20 Years

What I like about EE Bonds is that they are guaranteed to double in 20 years, backed by the full faith and credit of the US Government.  That means if you buy $10,000 of EE Bonds in 2018, you will have $20,000 of EE Bonds to redeem in 2038.  This makes the effective interest rate of EE Bonds about 3.5%.  You should buy EE Bonds only if you plan to hold them for the full 20 years because you forfeit a lot of interest if you redeem (i.e., sell) the EE bonds early.

Taxes

Interest on any US Government bond (such as the EE Bond) is taxable at the US Government level only – not at the state or local level.  For EE Bonds, although interest is accrued to your account every year, you don’t have to pay taxes until you redeem your EE Bonds.  That means you don’t have to pay taxes each year on “phantom income.”

Pay for College

Series EE Bonds are a great way to save for your child’s (or grandchild’s) college education.  You can buy EE Bonds in addition to contributions that you make to a 529 Plan or other college savings plan.  You, as parents (or grandparents), buy and hold the bonds in your name and name the child as beneficiary.  That way the child has no “kiddie tax” issue.  (More on that in a later posting.)  You may also be able to exclude (i.e., not pay taxes on) a part of the EE bond interest, but only if you redeem the EE Bonds in the same year as you have to pay your child’s qualified education expenses and only if your AGI is below about $150,000 jointly (for this year).  

Example

To use EE Bonds to pay for college, there are several ways to accomplish your goal.  For all, I am assuming you are married so that you can buy $10,000 per person or $20,000 total of EE Bonds per year, meaning that in 20 years your student will have $40,000 to pay for college since the face amount is guaranteed to double.  The most straightforward way is for each parent to buy the maximum when they get pregnant or when the baby is born.  Keep the EE Bonds in the parents’ name at this point.  EE Bonds mature in 20 years, but college starts in 18, so you may have a couple of years to bridge.  You can:

  • Use other savings such as the 529 Account to pay for the first 2 years of college, then redeem EE Bonds to pay for the last 2 years.
  • Borrow through Qualified Student Loans and use proceeds from matured EE Bonds to pay off the student loans afterward.  You don’t get the tax benefits this way but at least you have a source to pay of student loans.
  • Go to junior college for 2 years, then use EE Bond proceeds to pay for the Bachelor’s Degree program.
  • Redshirt your child in grade school so that they don’t start college until 19 – that is if you can stand having them around your house for an extra year.  
  • Better yet, have your child work after high school and then go to college.  Probably won’t fly with the kid, but it is an option.

IMO

I am writing this post because I’m guessing many people don’t know that Series EE Bonds still exist and that they still present an excellent opportunity for long-term savings, whether for college or for any other goal.  It is easy, since all you have to do is go to the treasurydirect.gov website and open an account.  EE Bonds enforce discipline because their full benefit is realized only if you hold them for the full 20 years.  I recommend you consider EE Bonds as part of your overall savings plan.

Save Now for Medicare Costs

It is currently Open Enrollment for Medicare plans for those 65 years old and over.  Although most of my readers aren’t yet 65, some are, and some will be soon.  Like everything else, costs are going up.  No surprise there.  Although Part A is “free”,  Part B costs money based on your income, and Part C costs whatever your insurer says it costs.  One recent story said it can cost $20,000 per year per person for Medicare, which is probably in the ballpark.  The story went on to say some retirees are more afraid of what their health care will cost than what they will spend elsewhere in retirement.

Young Enough To Save

If you are still working and not yet of Medicare age (65), the time to worry about Medicare costs is now.  Why save all of the worry until you actually retire when you can start worrying now?  The younger you start saving, the more money you will have in retirement.

HSA

One strategy for saving for future Medicare costs is through a Health Savings Account, or HSA.  The IRS says you can have an HSA only if you have a “high deductible” health insurance plan.  As it is almost time for Open Enrollment for regular health insurance, you can see which plans are designated as “high deductible” and which are not.  Most high deductible plans are Bronze plans.  You cannot set up and contribute to an HSA unless you have a high deductible health care plan.

Your Money

The good news is that money you contribute to an HSA but that you don’t use during that calendar year is still your money.  This is unlike Flexible Spending Plans, which are actually deductions from salary that are “use it or lose it” for each calendar year.  Any money you don’t use in an HSA, you can save for next year…or for many years down the road,.

Use an HSA to Save for Medicare Costs

What I am suggesting is the following course of action:

  1. Enroll in a high deductible plan and open and contribute to an HSA.  For 2019, individuals can contribute up to $3,500 and families up to $7,000.  Some employers will also match a portion of your contributions, so look for this in your benefits package.
  2. Don’t withdraw money from your HSA during the current year.  Instead, let the money sit there and plan to use it when you retire.  It is like an IRA – earnings grow tax-free, and withdrawals are tax-free as long as they are for qualified medical expenses, including Medicare premiums.
  3. Instead, pay your current year medical deductibles out-of-pocket.  This will hurt at the outset of your plan year until you meet your deductible, then it will normalize.  The problem is, most workers’ take-home pay is lower earlier in the year because of Social Security taxes and perhaps also 401k contributions, so it is a big hit while you are also paying for higher medical deductibles at the same time.  However, this is short-term pain that will be worth it as your HSA builds.

How Much Can You Save?

Let’s say you start an HSA at age 55 (and I am suggesting you get started earlier).  If you save the maximum $7,000 per joint return for 10 years until you are Medicare-eligible, and you can earn 2% on it, using my financial calculator, you will save $76,648 in 10 years.  Although it is probably not enough to pay your Medicare premiums in full for the rest of your life, at least it will be a start.  Much better than no medical savings at all.  Again, withdrawals from the HSA to pay for Medicare costs will be tax-free to you.  

IMO

This is another way for me to tell you to eat your vegetables, but for those that just go to work every day, it is a good long term strategy for saving for retirement expenses and for limiting your taxes.

Put/Call Ratio

Particularly if you are a short-term trader, meaning that you trade index ETF’s or their options on a relatively frequent basis and that your hold period is relatively short, such as 1 to 5 days, then the Put/Call Ratio is an important piece of information.  

Calculation

The ratio is calculated just as its name is implied:  The total number of put options across all equities and indexes traded during a day divided by the total number of call options traded during a day.  Puts are options to sell and Calls are options to buy.  If more Puts than Calls are traded during the trading day, that means market sentiment is more bearish, or more with the Sells than the Buys, and the Put/Call ratio will probably be over 1.0.  Conversely, if more Calls than Puts are traded, market sentiment is bullish and the Put/Call Ratio will probably be below 1.0.

Chart

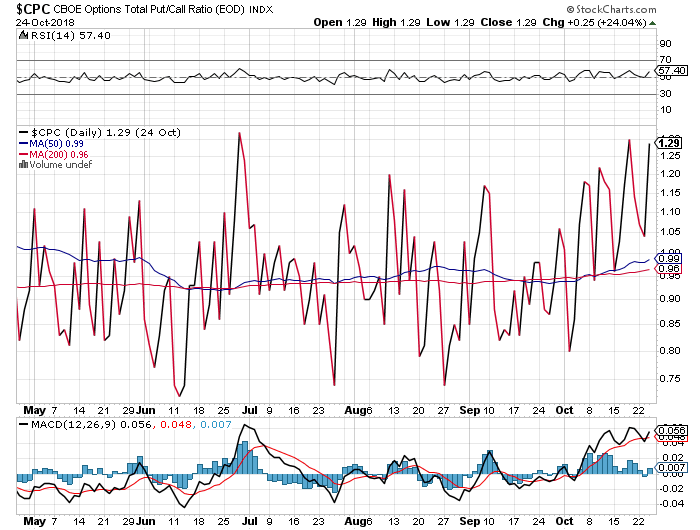
The following is a chart from StockCharts.com of the $CPC, which is the symbol for the Chicago Board Options Exchange Total Put/Call Ratio, End Of Day, as of the end of trading on Wednesday, October 24, 2018, a day when the major indexes sold off from 2% to 4%:

Interpretation of the Chart

There are several things that I find interesting about the chart, things that you might be able to use in your trading or at least in your understanding of what the Put/Call Ratio tells us about the current status of the market:

  • The Put/Call ratio closed at 1.29, which is extremely high.  As you can see, we haven’t gotten close to that figure very often since May.  This means the day’s trading of options was highly skewed toward the bearish Puts.
  • Notice what subsequently happened on the chart in prior times when the Put/Call Ratio exceeded 1.2, or even 1.15?  It quickly turned around and went back down.  This means that investors started to buy more Calls, and the market went back up.  The Put/Call Ratio doesn’t predict the magnitude of the change, but it does indicate when the market may be at an inflection point.
  • Conversely, notice what happens when the Put/Call Ratio gets too low, say below about 0.85?  It turns around and goes back up, meaning the overall market corrects.
  • The chart shows that the 200-Day Moving Average of the Put/Call Ratio is 0.95, or slightly below 1.0, which is what you would expect.
  • However, the 50-Day Moving Average is 0.99, which is higher than the 200-Day Moving Average, which indicates to me that market sentiment has turned more bearish in the shorter term than it is normally over the longer term.

Use it to Trade?

There has been quite a bit written about using the Put/Call Ratio to trade.  Google it and read for yourself.  Some articles use the daily ratio, while others use a moving average of the ratio to make decisions about trading.  My take is that, while I wouldn’t trade solely based on the Put/Call Ratio, I think it is a useful piece to use in your overall decision.

IMO

The chart that I use in this article goes back only to May 2018, and it is unwise to draw any conclusions from such a short period of data.  That said, we will see in the ensuing few trading days if we indeed entered the trading day on Thursday October 25 in an oversold position and that the market will rebound from there.  Even if the market does rebound, one should not draw a definitive conclusion from the move, but it is nice information to know.