Emerging Market Investing

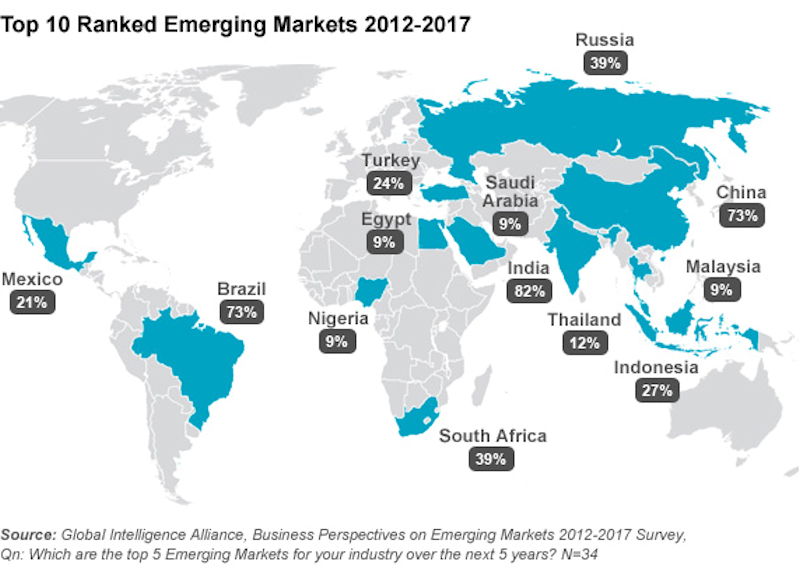
Investing in emerging markets sounds like a great idea but it is difficult to do successfully if your native currency is the US Dollar.  It is difficult for a number of reasons, including the following:

  • Some emerging market currencies are not easily convertible to US Dollars at a reasonable exchange rate.  
  • Some countries do not allow direct investment in their businesses by Americans or any foreigners.
  • Tariffs can really hurt emerging market economies, both because of the added cost of the tariff and because of the political uncertainty associated with them.
  • The exchange rate will continue to be a problem even after you have invested your money.  Right now, for instance, the US Dollar had been killing emerging market currencies.  Emerging markets have been significantly hurt by extreme devaluations particularly of the Argentine Peso and the Turkish Lira.  
  • Interest rates:  The US has been raising interest rates while most of the emerging market world has not.  The result of this differential in rates is that the US Dollar goes up and emerging market currencies go down.  So, even if an emerging market company is performing well in its native currency, Americans investing dollars in that company may be losing money because of the currency effect, which is largely driven by differences in the direction of interest rates in the respective countries.
  • Want to buy a mutual fund that specializes in emerging markets?  That is a possibility, but do your research before you buy.  Many emerging market mutual funds charge high expenses – reasonably so due to the travel and other expenses commensurate with managing investments in emerging markets all over the globe.  Go to Morningstar.com and research the holdings of the fund that you are interested in.  Many of these funds’ top holdings are banks and financial services companies domiciled in emerging markets.  You think about Emerging Markets and you think about cheap labor for manufacturing and you think this is where all the money is being made.  However, many emerging market industrial companies are not publicly traded.  As a result, the fund managers revert to owning financial service companies, which is a derivative play with respect to where the growth in these emerging markets is.  My point is, you may not be getting a true emerging market investment experience when you invest in emerging market mutual funds.
  • This includes ETF’s.  The largest emerging market ETF is the EEM, which tracks the iShares MSCI Emerging Markets Index.  Its two largest holdings are Tencent (China) and Taiwan Semiconductor, both of which are huge companies.  Country-specific ETF’s, of which there are many and probably one for any country you can think of, are also weighted toward the largest public companies in each country.  Nothing wrong with any of that, but you are investing in large companies, including many banks, when you invest in ETF’s such as the EEM or country-specific ETF’s.  
  • There are alternative investments such as hedge funds and private equity that specialize in emerging markets, but you really have to know what you are getting into, and you will likely pay high fees and be unable to cash out when you might want to.  

IMO

I view Emerging Market investing as a component of a well-rounded portfolio.  It makes sense that, while the US is the world’s largest economy, it is not the majority of the world’s economy, and that there are probably some great growth opportunities in emerging markets.  With the way emerging market investing is currently constituted, you can capture some great growth opportunities through investing in mutual funds and ETF’s, but it is difficult to find a pure play in emerging markets.  Another way to view emerging market investing is as a hedge against a weakening US Dollar, if current trends reverse and the Dollar starts to weaken.  
Clean Out Your Cupboard

My wife and I recently cleaned out our cupboard. We had bought some new cups and glasses and the cupboard was now too full. It had been several years since we had cleaned up the cupboard and we had accumulated a lot of items that we found that we weren’t using. Our children are either working (and off the household payroll!) or away at college (and still very much on the payroll). So, a couple of weeks ago, it was out with the old and in with the new! Most of the “treasures” that we either tossed or donated probably won’t be missed – we didn’t talk with our kids about this. Now the cupboard is much less crowded and much easier to deal with. Now it is a joy to open it up and see all of our glasses and cups properly arranged and easily accessible!

The Moral 

The moral of the story:  Clean out your own cupboard, in the greatest meaning of the phrase.  As we get older (and we all do), things we accumulated over time may not have the same application or use now that it did when you bought it.  When you get to a certain age, you want to move forward with less, not more.  It’s easier to maneuver that way and things are more orderly.

Rebalance

This goes for investments as well as for personal possessions.  A stock you bought several years ago may have already run its course.  Maybe you are hanging on to that stock because you haven’t gotten around to selling it, or you think it still has room to run.  Instead, maybe you should sell it now and redeploy the money into something you think can grow at a higher rate, or don’t redeploy it and keep it as a cash gift to yourself.  One way to “clean out the cupboard” in your investments is to rebalance your portfolio at least once per year.  Set a goal of what your asset allocation should look like – say 60% stocks and 40% bonds – and make sure it looks like that every January 2, or any other date of your choosing.  

IMO

Just like some people need a personal trainer to motivate them to get to the gym and do their exercises, you may need a Financial Planner to keep you in financial shape.  The Financial Planner will encourage you to clean out your cupboard (financially), not necessarily because they are paid by the transaction, but because it is in their best interest to do so.  Please contact me if you want help cleaning out your own cupboard!


Spending During Retirement

How much do you think you will spend once you retire?  Most likely, you believe your spending will go down once you retire.  A Rule of Thumb is your spending during retirement will be 70% of what it is when you are working.  

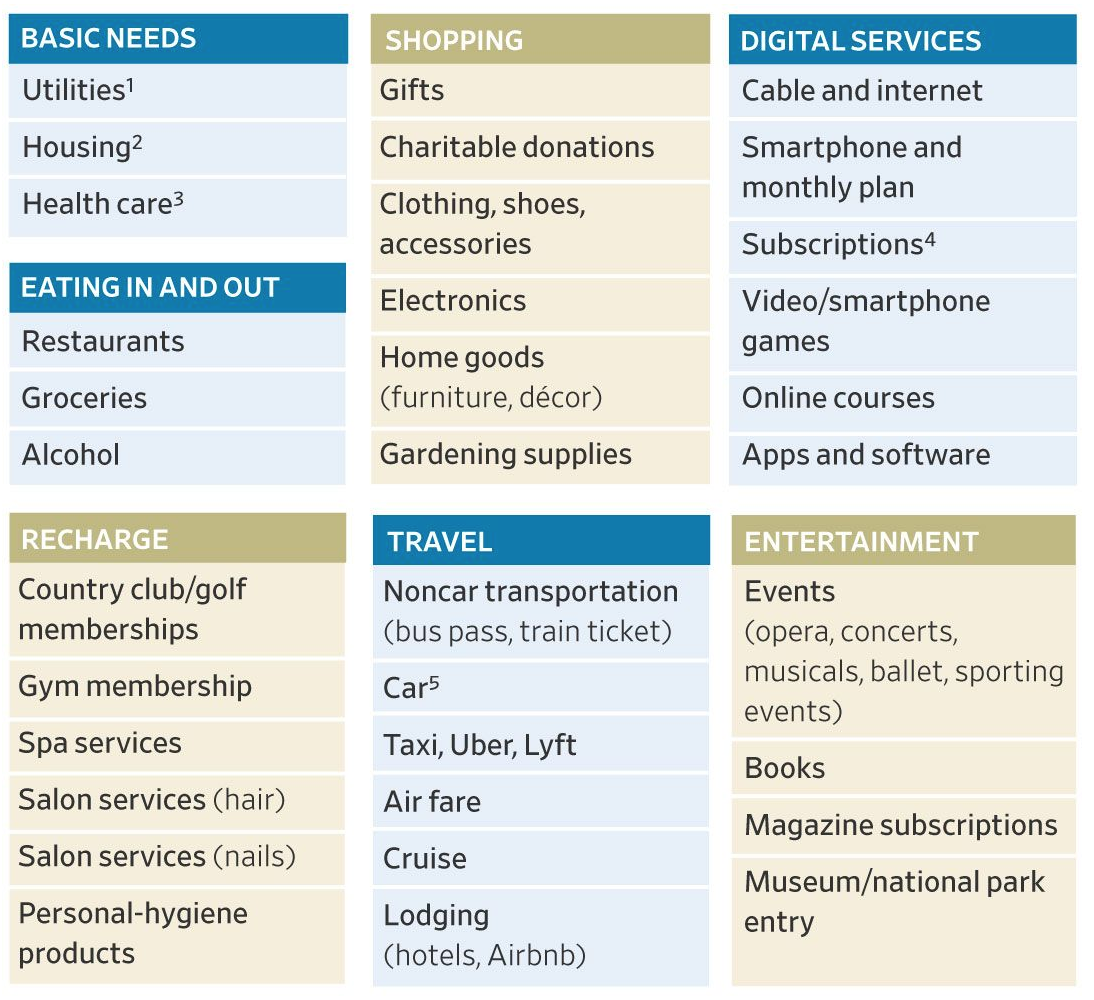
Does the 70% Rule of Thumb work in practice?  This article from a recent edition of the Wall Street Journal suggests that not only is 70% of pre-retirement spending too low of an estimate but that your retirement spending may actually be more than you spend while you are still working.  Once you retire, you will have a lot more free time to do things, many of which cost money.  It costs a lot just to run a home!  I spend almost $100/month just for internet access.   You have to have internet access these days, right?  Add cable or satellite TV to that.  Did you “cut the cord”?  Not really, if you are still paying for internet access.  Especially if you are still working and already on a tight budget, I can understand how your spending can increase instead of decrease during retirement.

Chart

What I find particularly useful about the WSJ article is the chart it has in it, which is shown above.  The chart is really a checklist of categories to consider when you think about what you spend your money on.  The bulk of the article discusses each item in the chart and explains what each means.  I suggest using the chart as a starting point for you to do an inventory of what you are currently spending money on.  Then, look at each spending item and think about whether it “sparks joy” for you.  Or, if it doesn’t spark joy, maybe it is necessary – insurance doesn’t spark joy, but you have to have it.  If you are thinking about retirement in the next several years, use this chart to create an action plan of what you want to cut out.  Because, if you don’t cut anything out, your spending could easily go up during retirement instead of down, and you may not have enough money, especially if you remain in good health and live a long time in retirement.

IMO

While you are working, you should always have an action plan for what you plan to jettison if something bad happens, such as loss of a job, huge medical bill, or loss of a spouse or a loved one.  When you do actually pull the trigger and retire, use this chart as well as your current expenditures as a path toward knowing how you are going to afford your retirement.  Do you know any older people who worry a lot?  Don’t be a worrier in retirement – put your retirement spending plan together and execute it.  You will be happier in retirement if you do.  Need help?  Contact me!

Greatest Economic Risk

My son who is taking an Economics class in college asked me, “What is the greatest Macroeconomic risk we currently face?”  I responded that it was Monetary Policy – he needed only a general area of risk.  What I really think is that the greatest Macroeconomic risk is how the economy responds as the Federal Reserve reverses course and sheds assets over the next few years, as it has said it would do and as it has, in fact, started to do during the past few months.  I didn’t lie to my kid – this is a part of Monetary Policy.  I believe the Fed’s actions with respect to its own balance sheet is the greatest current Macroeconomic risk because it hasn’t been done before and because another economics-related branch of government, the Congressional Budget Office, doesn’t even list the Fed’s asset sales as a risk in its most recent economic forecast.  It is often the part of the iceberg that you don’t see that poses the greatest risk.

$4.4 Trillion

The Fed’s assets peaked in 2014 at about $4.4 Trillion.  The Fed’s assets on their balance sheet consist of debt instruments (Treasury securities, mortgages, and other government-backed debt).  The Fed started aggressively to purchase debt in the open market as the Great Recession hit in 2008-2009.  The Fed’s purchase of debt provided liquidity to the markets and helped the economy to recover from the Recession.  They continued to buy so much debt that their balance sheet grew from about $1 Trillion when they started to $4.4 Trillion.  I previously wrote about this in my post of March 30, 2018, titled “No Playbook“.  Football coaches operate with a strict playbook.  The Fed is currently operating without one that they have tested during practice.

Now the Fed is starting to go the other way:  Selling assets instead of buying them.  In reality, the Fed is simply not repurchasing assets as they mature and fall off of their balance sheet.  After holding steady in the $4.4-$4.3 Trillion range since 2014, the Fed’s assets have shrunk this year by about $200 Billion, and are now at about $4.2 Trillion.  The Fed is hoping that this gradual sell-off of assets will not disrupt the economy that much.  They are taking the training wheels off gradually.  Let’s hope that they are correct.  The economy is strong now by most measures.  If the economy unexpectedly begins to weaken, the Fed might be forced to curtail or even reverse its bond selling program, which would not be good for the Fed’s credibility.  

The CBO

The Congressional Budget Office (CBO) puts out a periodic Macroeconomic projection.  The most recent projection was published on August 13.  The projection mentions various issues they see that may have a negative impact on the US economy.  Trade issues, tax cuts, and interest rates are mentioned.  The mainstream media mentions these as well.  Fed policy relating to asset sales and shrinking its balance sheet is not mentioned as a risk in the CBO projection.  That makes me worry.  For the past 10+ years, our economy has been helped along by the Fed’s ballooning balance sheet.  That balloon will be having air let out of it – gradually, but still with less inflation.  I certainly see this as a Macroeconomic risk.  The CBO misses this risk.

IMO

I do not see our economy going into a recession because the Fed has started and will continue to reverse course.  However, if the Fed needs to re-reverse, there could be hell to pay.  My point is to pay attention to the Fed’s actions (I will keep you posted) and see what happens but be aware of what is happening.  

Longest Bull Market

Last week, the week of August 20, marked the Longest Bull Market in history.  This means 3,453 days had elapsed since the start of the bull market in March 2009, which surpassed the previous record bull market that ended in March 2000.  Although this current bull market is a record in length, it is not a record for return percentage, as the 1990’s bull market (fueled by the dot-com boom) saw a 417% increase, vs. “only” 322% for this bull market.  Nevertheless, darn good returns.

What Does It Portend?

What does having just experienced the Longest Bull Market mean with regard to stock prices and investment returns going forward from here?  In a word, Nothing!  The fact that we have had a 10-year bull market doesn’t mean you shouldn’t go in and buy stocks tomorrow.  The two are not statistically correlated.  “Yes, but it can’t go on forever, can it?”  Probably not – forever is a long time – but it certainly can continue for a while longer.  The underpinnings for a strong stock market are still there: strong corporate earnings and relatively low interest and unemployment rates.

Sports Psychology

Any sports psychologist will tell you that the athlete’s sole focus during competition should be on the next thing – the next play, the next pitch, the next hole, the next serve.  Athletes are taught to have zero memory during competition, whether the athlete has been performing well or not.  Always look forward and never backward while competing.  The same should be true for investors.  Look forward, not backward.  Just because the market has been strong doesn’t mean that it won’t be strong in the future.  In fact, perhaps just the opposite.

IMO

When investing, keep your game face on.  Don’t fret over missed opportunities in the past.  Don’t think that you are better than you are because of a recent hot streak.  Instead, keep your goals in mind and go out and execute your plan.  Don’t be a Glass Half Empty person and think the markets are bound to correct because they have been going up for so long.  That type of mental predisposition is a recipe for failure.  As the British say, Keep Calm and Carry On.

Instant Gratification

Together with my family, I recently went to a restaurant that was located in a remote area.  When we got to the restaurant, we found that we didn’t have cell phone service.  Perhaps the restaurant had WiFi, but we didn’t ask.  

No Cell Service

Normally, during dinner at a restaurant, my family does what many other families do during dinner:  play with our cell phones.  Because we didn’t have cell service at this restaurant, we were forced to talk to one another.  This went well for a while until one of us was unsure of a fact.  We went to look up the fact – but we couldn’t.  No cell service!  Our discussion went unresolved as a result.  To be continued.  None of us were used to that.

Instant Gratification

We are all now so used to getting what we want the second we want it.  If we want to know something, we look it up right then and there.  This works better and better in information technology as internet speeds improve.  Patience is not a virtue when you have all of the world’s information available to you in the palm of your hand.  Our children have grown up used to this level of availability and they are largely impatient as a result.

Investing Takes Time

The problem is that this Instant Gratification culture doesn’t work in the investing world.  Investing is a long, hard slog with ups and downs along the way.  You pick a target for your net worth and hope and strive to hit that target 10 or 20 years from now by earning that 8% per year and compounding your gains.  Saving and investing and building your net worth is more like farming.  Your goals take time and nurture to materialize.  Patience is not just a virtue but is absolutely necessary to be a good investor and successfully to build your wealth.  If you join a hot start-up and become a millionaire early on when your company goes public, good for you, but that is the exception rather than the norm.  Now, with online trading access, you can monitor your portfolio constantly and in real time, but that is different than actually becoming wealthy overnight.  Even that can be counterproductive because buying and selling stocks based on daily news and daily trading fluctuations is likely not the best investing strategy.

IMO

There is nothing wrong with playing with your phone instead of talking with the rest of your dinner party.  There is nothing wrong with looking up something because you want to know it right then and there.  My point is that you shouldn’t translate the Instant Gratification mindset into your investing plans.  Successful investing takes time and patience as well as discipline.  It can still be an enjoyable adventure but it won’t happen overnight!

Aretha Franklin, R.I.P.

Everyone is paying tributes to Aretha Franklin, so I will take a part of her recording history and see if it might have a lesson for you.

Columbia Records

Aretha started in her professional career with Columbia Records in 1961.  She was a young, extremely talented singer with a background in gospel music.  She was not the only one at the time.  Although she did have some commercial success while at Columbia, the relationship was not a home run.  According to some reports, the head guy at Columbia did not really “get” Aretha and her gospel music talent.  Had Aretha stayed with Columbia, she likely would not have had the success that she ultimately had.

Atlantic Records

Aretha moved to Atlantic Records in 1967 and her career took off, despite personality issues between her family and Atlantic executives.  Unlike Columbia, Atlantic Records recognized Aretha’s talent and matched her with songs and styles that fit her talents.  Aretha’s biggest hits, such as “Respect”, “Natural Woman” and “Chain of Fools” were all from the Atlantic period.  Aretha clicked with the team at Atlantic, and the pair made it big.  

Later

Aretha’s producer at Atlantic Records, Jerry Wexler, departed to another company in 1976, and Aretha departed Atlantic in 1979.  Though a few hits followed during the 1980’s, Aretha didn’t have the same commercial success after she left Atlantic.  There are probably a number of reasons why, and other singers probably would be thrilled with the level of success that Aretha had post-Atlantic, but Aretha’s best years were behind her.  My point is that the team of Aretha and the executives at Atlantic Records brought Aretha the success she had and deserved.  

IMO

How many Arethas are there out there now or were there back in the day that had the talent but weren’t matched correctly with the professionals necessary to move their careers forward?  Do you think that relates to you and your activities?  Talent alone isn’t enough.  Talent has to be nurtured, guided, and put on the proper path to success.  If that is in the field of investing or financial planning, it is best if you team up with a like-minded professional who understands you and your goals and can set you on the proper path for you to meet your goals.  Don’t go it alone, and don’t try to make it work with people with whom you don’t mesh.  Demand excellence for yourself and demand that the people who are there to help you actually understand you and put your goals first.  Just like Atlantic Records did with Aretha.

Safe Houses

I enjoy reading spy novels, particularly those about the Cold War.  Through my local library, which is a wonderful facility, I am reading “Safe Houses” by Dan Fesperman, one of a number of authors who practice in the spy novel genre.  Though not great literature (most spy novels aren’t great literature), “Safe Houses” is a good read so far.

The title got me thinking, are there any “Safe Houses” in the investment world?  A safe house in the spy world is usually a house controlled by a foreign country’s spy agency.  The US CIA had (and probably still has) safe houses in Germany and in eastern Europe where its spies can hang out between assignments, and where other people can watch out for them and therefore be safe.  If you watch “Homeland” on Showtime, you know what a Safe House is.  Maybe also the Ryan Reynolds/Denzel Washington film of the same name.

Gold

Is gold a safe house for investors?  Right now, no, it is not.  Gold has historically been a hedge against inflation and geopolitical turmoil.  What do we have now?  Inflation that is slightly higher now than it has been for the last several years (albeit still pretty low) and geopolitical turmoil, at least if you watch the mainstream media.  No major war, though.  We also have incessant TV ad spots touting gold. Yet, gold is hitting new 52-week lows.  Don’t believe William Devane and the TV ads.  Gold isn’t dead as an asset class, but it is not a safe house right now.  It may turn out to be a great investment if we do have a real war and much higher inflation, but I wouldn’t park money in gold right now if you are worried that the stock market is overbaked.

Real Estate

Residential real estate, in particular, is more of a safe house, especially in areas such as where I live in California where there are growth restrictions, both natural and unnatural.  Housing demand remains high, particularly affordable housing,  Affordability is key because so few households make enough money to qualify for the mortgage they need to buy the house they want.  Yet, there remains the liquidity issue:  It is more difficult to sell your property when you need to than it is to sell a stock or bond.  And, there remains the issue of interest rates, which will also price more people out of buying a house as rates move up, even as slowly as they are.  Yet, if you currently own or can purchase residential real estate at a relatively affordable price in a favorable location, chances are you will be safe in the long term.

US Treasuries

Unless you are a true believer in the impending apocalypse, US Treasuries are extremely safe, with a big If:  If you hold your treasuries until maturity, you will get back 100% of your principal plus your coupon interest.  If you sell your treasuries before they mature, you could lose some of your principal if interest rates have moved upward since you purchased the treasuries.  This is called Duration Risk.  If you like the almost-3% return on 10-Year US Treasuries and you absolutely need all of your money back, then you need to hold them all 10 years.  Of course, there are shorter terms – with all of the US debt, there is any maturity available that you want.  Now, with rates higher than they have been, US Treasuries are at least a somewhat appealing alternative that offers a safe return.

Cash

Cash is the safest of all, but it isn’t really an investment because you don’t get a return on cash.  When you have a brokerage account (including a retirement account) and you don’t invest all of the money in your account, the uninvested portion is usually “swept” into a money market account, which pays some return, albeit smaller than US Treasuries.  Most financial planners consider money market funds to be “cash”, and it is 100% safe if it is under $250,000 and therefore insured by SIPC.  When I want to stay completely “safe”, which is typically when I am seeing that we are not in a strong period for the stock market, I will opt for “cash” that is swept into a money market account rather than to buy US Treasuries because I know I won’t lose money when the stock market rights itself and I venture back into the fray.

IMO

These are just a few of the “safe houses” out there for investors.  Stocks by definition are not a safe house because their values are constantly changing in the stock market.  Safe means you will get 100% of your money back.  Don’t buy gold now if you want to stay safe, although you might want to if you want to speculate.  Consider residential property if you don’t need the liquidity, and definitely go with US Treasuries if you hold to maturity and cash if you want short-term safety.

Backward and Forward

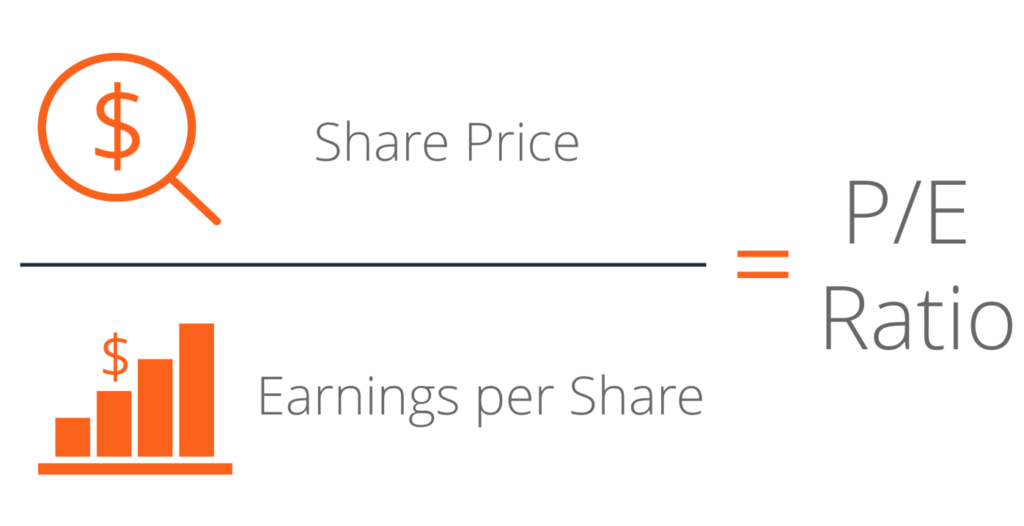
As you may have guessed from the title, this posting is about the Price to Earnings Ratio (P/E).  P/E is one of the most common fundamental and quick ways to determine if a stock is relatively cheap or relatively expensive.  

Two Ratios

There are really two P/E ratios:  One that looks backward at previously-announced earnings, and one that looks forward at earnings projected by analysts.  If the company’s earnings are rising, the backward P/E will be a larger number than will the forward P/E.

WTF

Let’s take an example of a company I will call the WTF Company (because ABC is already taken by AmerisourceBergen).  WTF trades at $50/share and announced earnings of $0.625/share in the last quarter.  $0.625 times 4 is $2.50, and $2.50 times 20 is $50, so WTF is trading at 20 times earnings, or at a P/E of 20.  Always remember to take the latest quarterly earnings and multiply by 4 to get the annual earnings, unless it is a seasonal business such as retail and you are looking at the Christmas quarter, so you have to smooth out the earnings.  But I’m getting beyond my point.  My point is, let’s say WTF’s earnings are projected to grow by 10%.  This means next quarter they should earn $0.6875, which, times 4, is $2.75 per share annualized.  What does that mean for the P/E?  It means the forward P/E at $50/share is 18.18.  That doesn’t look as high as 20, and maybe you can feel comfortable buying a stock with a n 18 P/E where you wouldn’t feel comfortable at 20.  Remember, you buy a stock for the company’s future earnings, and while their past earnings can tell you something about how well the company is run and what you might expect for the future, you should be looking to the future more than the past.

IMO

The next time you have a conversation with someone about stocks and they mention the P/E ratio, ask them if they are talking about backward or forward P/E.  Chances are if they think stocks are priced too high and that we are about to have a downfall, they are talking about backward P/E.  However, if they are looking for reasons to buy stocks, chances are they are talking about forward P/E.  When you hear or read the term “P/E”, the default meaning is backward P/E.  However, investors tend to look forward.  In an era such as this when corporate profits are rising significantly, there is going to be a disconnect wherein adherents of P/E and metrics such as the Schiller CAPE Ratio (another expression of backward P/E) will be sounding the warning sirens.  If the forward P/E is more in line and you believe there is a good chance companies will meet or exceed their profit projections, then you don’t need to take cover when the sirens sound.

Relative Strength Index

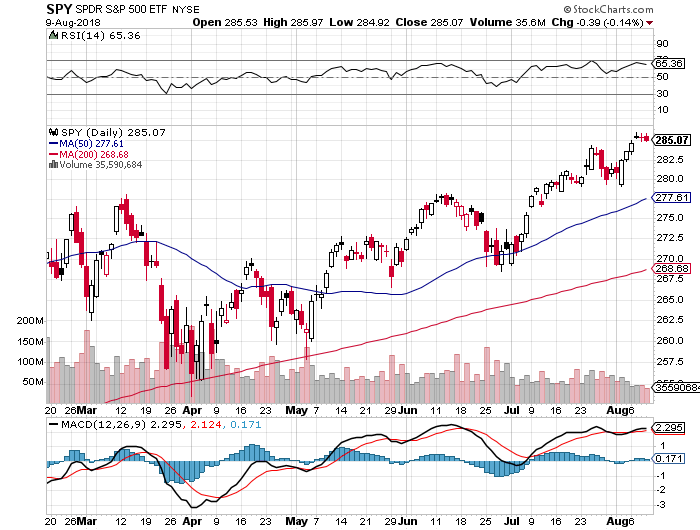
Relative Strength Index (RSI) is a commonly-used technical indicator. RSI is a momentum oscillator that measures the speed and change of price movements.  RSI is presented as a number between 0 and 100.  A high number within that range indicates that a stock has been performing well, and a low number indicates the opposite.  A number between 30 and 70 is considered normal by the “experts”.  A number below 30 is thought to mean that the stock is oversold, while a number above 70 may mean the stock is overbought and therefore may be ripe for a correction.  Maybe.  I will get into that below.    Here is a link from Stockcharts.com/school that gets into RSI more deeply, including how to calculate the RSI.  RSI’s calculation includes a running lookback period of 14 days, meaning that data from more than 14 trading days ago is no longer relevant.  

Free

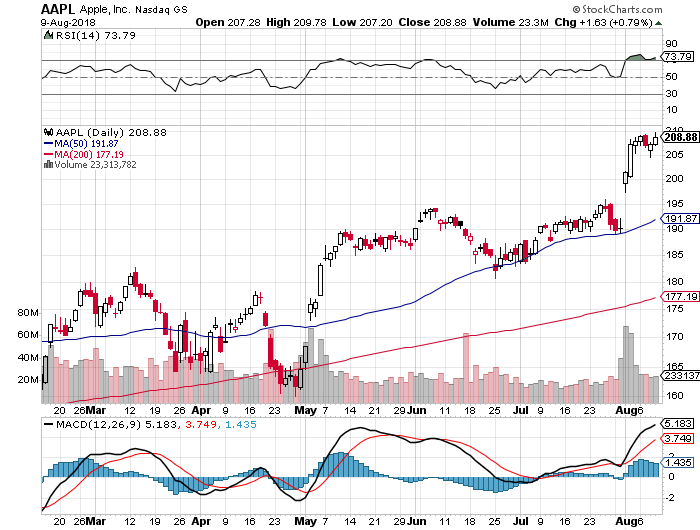
When you go to the free stock charting website Stockcharts.com and type in a ticker symbol, in addition to a daily chart of the stock for the past several months, you will also get a chart of the stock’s RSI, typically shown above the actual stock chart.

AAPL

Just to use one example, this of the now $1 Trillion Apple, Inc., the RSI of AAPL (as of this writing) is 73.79.  By the book, this means AAPL may be overbought since it is over 70.  However, let’s look at this more closely.  AAPL last week announced strong earnings, which caused the stock to bread that $1 Trillion barrier.  Kind of like Chuck Yeager and Mach I, or Roger Bannister and the 4 Minute Mile.  Do you think AAPL is ripe for a correction?  I don’t believe it is, but it certainly might.

S&P 500

The RSI is also helpful as applied to indexes, such as the S&P 500 Index.  Below is a chart of the SPY, which is the ETF proxy to the S&P 500 Index.  Its RSI currently is 66.36, which is high but still below the 70 “barrier”.  This implies that the S&P 500, while high, is not overbought and therefore may have room to run upward still. 

In My Opinion (IMO)

The purpose of this posting is to inform, not to advocate.  The Relative Strength Indicator is out there as a piece of information to take into account when looking at your holdings to determine whether to buy, hold, or sell.  I do not recommend that you make trading decisions solely based on the RSI, such as, “The RSI is below 30!  Great Buying Opportunity!  I must buy!”  Don’t do that!  Just be aware of the RSI and what it implies and you will be a more educated investor.  With a later posting I will discuss the other information on this chart, such as the MACD, which is the stock’s moving average.