Copper and Gold are both metals that are mined from the Earth, yet they have very different and sometimes opposite associations. Copper is associated with economic growth and Gold is associated with safety. Copper’s price increases when it is perceived the world is in a growth phase and Gold does well during periods of uncertainty. The ratio of the price of Copper to the price of Gold is also informative – a higher ratio means investors see more opportunity for growth than there is uncertainty.

Copper
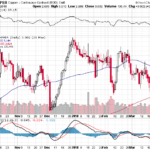
Copper is a proxy for growth because nearly all electrical wiring and some plumbing are made out of copper. Copper’s worth is in what its uses are. Copper isn’t just used in commercial and residential real estate and construction. According to this article, a new electric car is wired with 150 pounds worth of copper, which is 3 times more Copper than is in a traditional car. The article goes on to say that the International Copper Association predicts a tenfold increase in Copper demand for use in electric vehicles by 2027. If you believe in the growth of electric vehicles but perhaps aren’t sold on Tesla, then buying Copper is a way to play your belief. Another play is that the supposed new infrastructure spending bill will also be bullish for Copper.obal gr The current price is Copper is $3.00 per pound, which is about $0.30 lower than the high of $3.30 reached in December 2017. The 10% reduction in value somewhat mirrors the reduction in the stock market since late January 2018. $3.00 is an important number because at that level or above it can be profitable for miners to start new copper mines.

Gold
It is said the Gold has intrinsic value. Lustrous, shiny, beautiful to look at in and of itself, Gold’s value isn’t what it is used for, but what it is. Because of its intrinsic value, Gold has forever been a safe haven for investors during times of crisis, geopolitical or otherwise. Copper isn’t safely secured under armed guard at Fort Knox. Pioneers didn’t head to California in 1849 in search of Copper. My recommendation is that all investors should own some gold. Just in case.
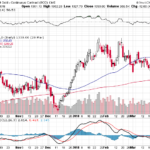
As the chart shows, after bottoming at about $1,240 per ounce in early December 2017, Gold rose to about $1,355 in January 2018 and has since been trading in a range of roughly $1,355 on the top to about $1,310 on the bottom. Interestingly, Gold went down a bit in early February 2018, when the stock market corrected 10%. The narrative was that stock correction was because of heightened inflation fears. If Gold is an inflation hedge, it didn’t really act like it during the February correction.

Copper to Gold Ratio
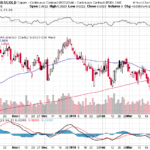
If Copper is about growth and Gold is about safety, then a rising Copper/Gold ratio would indicate future growth and a falling ratio would indicate future uncertainty, or that the growth picture growing forward isn’t as rosy. As you can see from the chart, the ratio has been falling slightly since making a high in very late December 2017. The chart is somewhat misleading because of the scale. The highest the ratio got in December was 0.0025, and it is currently at 0.0023 after hitting 0.0022 late last week. So the increments on the chart are very small, but the trend is telling. The trend in the ratio is another way to show that investors are feeling less gung-ho than they did in January. One take that I have is that the ratio was declining throughout January, which could mean it foretold the stock market correction in February.
IMO
So, are you a Copper person or a Gold person? Do you believe in the global growth story (Copper), or are you skeptical that growth will materialize and that the world economy will be more sluggish than robust (Gold)? One disclaimer is that everyone is a Gold person at some level because of its intrinsic value. I think the most telling is the ratio between the two. Right now I see the ratio as technically oversold and likely to correct upwards, meaning either Copper will go up or Gold will go down or both. Clearly, the “Gold” people have been winning this year so far and that has had major ramifications in the stock market.
The charts are from StockCharts.com, which is a free service. To get the quote for Gold, type in $Gold, and the same thing for Copper. StockCharts is very good – you get more than you pay for.
