Particularly if you are a short-term trader, meaning that you trade index ETF’s or their options on a relatively frequent basis
Calculation
The ratio is calculated just as its name is implied: The total number of put options across all equities and indexes traded during a day divided by the total number of call options traded during a day. Puts are options to sell and Calls are options to buy. If more Puts than Calls are traded during the trading day, that means market sentiment is more bearish, or more with the Sells than the Buys, and the Put/Call ratio will probably be over 1.0. Conversely, if more Calls than Puts are traded, market sentiment is bullish and the Put/Call Ratio will probably be below 1.0.
Chart
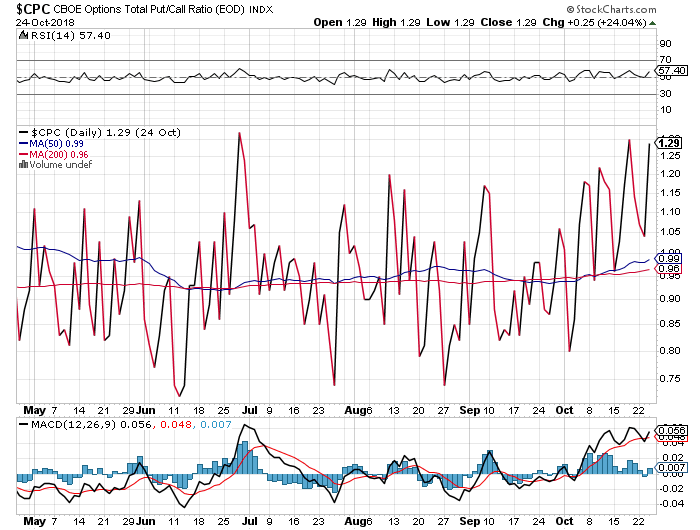
The following is a chart from StockCharts.com of the $CPC, which is the symbol for the Chicago Board Options Exchange Total Put/Call Ratio, End Of Day, as of the end of trading on Wednesday, October 24, 2018, a day when the major indexes sold off from 2% to 4%:

Interpretation of the Chart
There are several things that I find interesting about the chart, things that you might be able to use in your trading or at least in your understanding of what the Put/Call Ratio tells us about the current status of the market:
- The Put/Call ratio closed at 1.29, which is extremely high. As you can see, we haven’t gotten close to that figure very often since May. This means the day’s trading of options was highly skewed toward the bearish Puts.
- Notice what subsequently happened on the chart in prior times when the Put/Call Ratio exceeded 1.2, or even 1.15? It quickly turned around and went back down. This means that investors started to buy more Calls, and the market went back up. The Put/Call Ratio doesn’t predict the magnitude of the change, but it does indicate when the market may be at an inflection point.
- Conversely, notice what happens when the Put/Call Ratio gets too low, say below about 0.85? It turns around and goes back up, meaning the overall market corrects.
- The chart shows that the 200-Day Moving Average of the Put/Call Ratio is 0.95, or slightly below 1.0, which is what you would expect.
- However, the 50-Day Moving Average is 0.99, which is higher than the 200-Day Moving Average, which indicates to me that market sentiment has turned more bearish in the shorter term than it is normally over the longer term.
Use it to Trade?
There has been quite a bit written about using the Put/Call Ratio to trade. Google it and read for yourself. Some articles use the daily ratio, while others use a moving average of the ratio to make decisions about trading. My take is that, while I wouldn’t trade solely based on the Put/Call Ratio, I think it is a useful piece to use in your overall decision.
IMO
The chart that I use in this article goes back only to May 2018, and it is unwise to draw any conclusions from such a short period of data. That said, we will see in the ensuing few trading days if we indeed entered the trading day on Thursday October 25 in an oversold position and that the market will rebound from there. Even if the market does rebound, one should not draw a definitive conclusion from the move, but it is nice information to know.
