A Closer Look

In my previous posting titled “Why I Use Indicators”, I cited a Wall Street Journal article, which in turn cited data from the Philosophical Economics blog and Ned Davis Research which showed that the percentage of household wealth invested in the stock market is currently high at over 56%.  This is bearish for future stock performance.  

Taking A Closer Look

After I wrote that piece, I read a piece by noted economist Dr. Edward Yardeni that supposed that one reason why interest rates remain as low as they are (albeit moving upward) is that investors still own a lot of bonds because they are afraid that “this is going to end badly”, likely because it has in fact ended badly many times in the past.

Thus, the Philosophical Economics data suggest investors don’t own enough bonds, but the Yardeni blog suggests that investors still are awash in bonds.  These two pieces didn’t foot with one another.

The End Is Not Near

So, I went back and looked at the Ned Davis Research (NDR) data that underpins that WSJ article.  NDR’s data shows that the ratio of stocks to bonds as a percentage of household wealth has gone from about 1:1 in 2009 to over 3:1 currently.  During this time period, the S&P 500 Index has risen from about 756 to its current level of about 2,840, which is an increase of about 276%.  That tells me that most of the increase in the percentage of household wealth invested in stocks has been due merely to the increase in the valuations of stocks, and not because investors have been pulling money out of stocks and into bonds.  To me, this is not as alarming as if investors were switching from bonds into stocks.  Investors are merely riding the wave, not stoking the wave.  Maybe the end isn’t near after all.

The World Has Changed

Another insight is that the world has changed a lot and stock ownership has become much more widespread as technology has advanced and the cost to trade stock has plummeted over the years.  Consequently, I don’t know how relevant data from the 1950’s and through the 1970’s are in this analysis.  NDR weighs its pre-1980 data as much as more current data and I think that is not the correct way to look at the investing world.

IMO

I reiterate from my previous post that the better way to look at indicators is to glean what investors, in general, are saying about the future of corporate earnings and the resultant stock performance.  I believe we are still in a bull market and that we should continue to own stocks, depending on your personal situation.  By the way, the Philosophical Economics blog is excellent but it is dense reading.  They post very long blogs but only a few times per year.  If you are up at night, you should try reading one of their pieces if you want to fall back to sleep.  Its author purposefully remains anonymous, but they are very good.  Yardeni uses a different method, more like mine – he posts shorter blogs several times per month.  Read them both for good education.

Why I Use Indicators

A recent Wall Street Journal article examined 8 stock market indicators that are out there and in common usage.  The point of the article is that all 8 currently conclude that the S&P 500 Index is overvalued by between about 5% and 20%.  The indicator that the author (Mark Hulbert of Hulbert Financial Digest) says is the single best (the percentage of household equity currently allocated to stocks) predicts that the S&P 500 is overvalued by about 15%.  Here is a link to the article:

https://www.wsj.com/articles/the-8-best-predictors-of-the-long-term-market-1533521521?mod=hp_jr_pos1

Next 10 Years

Here is a summary of the indicators mentioned in this article as being the most statistically significant:

  • % of household equity allocated to stocks, from Philosophical Economics blog (higher is bearish, lower is bullish)
  • Q Ratio, which is market value divided by replacement cost of assets
  • Price to Sales Ratio of stocks
  • The ratio of Total Value of Equities to GDP, which is Warren Buffet’s favorite indicator
  • CAPE Ratio developed by Nobel Laureate Robert Schiller, which is a version of the P/E Ratio
  • Dividend Yield of the S&P 500 – lower is bearish, higher is bullish
  • Traditional P/E Ratio
  • Price to Book Ratio

Hulbert, the author of the article, is testing the predictive power of each of these indicators with respect to the expected returns of the S&P 500 over the ensuing 10 years.  Hulbert back tested each of these indicators to see how they would have predicted 10 year the S&P 500 performance using data back to 1951.  This is one way to use indicators, but it is not the only way, and it is not the way that I use indicators.

Why I Use Indicators

I use general institutional buying and selling, accumulation and distribution, as indicators to tell me the general direction of the market at a point in time.  I am not trying to predict what the stock market’s performance might be during the next 10 years.  Though I would not label my indicators as “short-term”, I would say that they are more “at the moment”, and indicative of market momentum at that time.  When my indicators tell me that institutions are in an accumulation phase, then I will allocate more of my assets to stocks.  When institutions are selling, I will sell stocks and allocate more to bonds or cash.  As it has been for much of the time since the 2008 Financial Crisis, currently my indicators tell me we are still in an accumulation phase and that we should still over-allocate toward stocks.  I am confident that if we do find ourselves in a correction phase, that my indicators will provide me enough warning to bail out before the worst of the carnage.  This is because I have personally backtested my indicators and that they showed red flags in time to live to fight another day.

IMO

The P/E and CAPE ratios have gotten a lot of press lately because they are historically high.  I say that this is because the markets are forward-looking whereas the ratios are backward-looking.  Investors see that corporate profits are up and will likely continue to rise for a variety of reasons.  Stock prices represent the expectation of future earnings rather than the past.  Because the outlook for corporate profits is so rosy, these ratios are historically high.  Q Ratio may be obsolete because we have transformed into a service and high-tech economy and the replacement cost of assets isn’t as viable a concept as it was when we were a manufacturing and hard-asset economy.  The point is that there are holes in a number of these indicators.  Even so, if the average over-valuation is in the 10%-range, and the stock market suffered a 10% correction, would that be so bad?  And do you believe that the market would eventually recover that 10% correction?  I believe so, and that is why I will continue to rely on my own indicators rather than those described by Hulbert in this WSJ article.


IT Spending

This is a great article published recently by columnist Christopher Mims in the Wall Street Journal.  Mims explains that recent research shows that the reasons why some companies make it while others don’t have to do with how much money companies spend on proprietary information technology systems and processes.  The reason the FAANG stocks have become such a disproportionate percentage of the market cap of the stock market is that the FAANG stocks account for a disproportionate amount of the proprietary IT spending.  Moreover, the gulf between these huge FAANG companies and smaller competitors will likely grow, not shrink.

Key Quote

Here is the key quote from Mims’ article, in my opinion:  “IT spending that goes into hiring developers and creating software owned and used exclusively by a firm is the key competitive advantage. It’s different from our standard understanding of R&D in that this software is used solely by the company, and isn’t part of products developed for its customers.”

Right Way/Wrong Way

Mims goes on to show that there is a right way and a wrong way for companies to spend on IT.  He uses the example of Wal-Mart and Sears, back a few decades ago.  Sears spent heavily on IT at the time but it spent it on outside consultants.  Wal-Mart built their own systems internally and developed their own proprietary scanning and inventory system.  Guess who won?  It appears that companies that develop their own software and systems and keep them for their own uses are the companies that win.

How to Tell

It is difficult to look at a company’s financial statement and tell how much they are spending on proprietary IT systems and how they are spending that money.  There may be narrative in the Annual Report or in press releases about IT spending and how it is being spent, which is helpful.  However, figuring out IT spending is more a qualitative rather than a quantitative skill.  I believe you have to read, ask, and read between the lines to figure out if a company knows what it is doing when it outlays money for IT.  It is helpful if you understand IT and have a working knowledge of what works and what doesn’t work.

IMO

This Mims article made me alter my opinion about why established companies grow bigger and why it is difficult for smaller companies to grow.  Although I still believe that regulatory hurdles are one issue why it is difficult for smaller companies to grow, I now understand that the scale and amount of money it takes to establish and maintain proprietary systems and processes means it is difficult for smaller companies to allocate sufficient resources in that direction.  Only the largest, most well-capitalized companies have enough money to pay for the brainpower they need to develop systems that set those companies apart.  Small and mid-cap companies face an uphill battle in order to compete with larger competitors who have a head start and more resources to spend on their own proprietary systems.


Earphones In

When you see people walking on the sidewalk with their earphones in their ears, seemingly oblivious to the world around them, what are your thoughts?  To me, I see someone whose thoughts are elsewhere and who is not “in the moment”.  Whether they are listening to music or a podcast or having a phone conversation, their attention is not with what is right in front of them, but instead with what is filtering into their ears.  They may believe they are multitasking and accomplishing more given the limited hours in a day, but they are also missing out on the beauty that is around them.  They are also a physical danger to those around them because their movements are less predictable:  Perhaps they will take their next step forward, but perhaps also they may veer left or right, unaware that their veer could put their bodies in jeopardy of a collision with others.

Avail Yourself

Ideas, including investment ideas or plans, can come to you at any time.  You just have to avail yourself to those opportunities, and the best way to do so is always to be aware of where you are and what is in front of you.  Be in the moment.  An example:  my idea for this blog topic came to me while I was on a morning bike ride.  I was on a bike path and there was a pedestrian in front of me with earphones in.  As a cyclist, your concern in that instant is perhaps the pedestrian doesn’t hear me coming and will inadvertently veer in my path and cause me to crash.  It has happened before – not to me, fortunately.  While some people do, I purposely do not wear headphones while cycling because I want to hear anything coming from behind.  I also want to avail myself to random thoughts that might spark an idea for me.  Now, maybe this pedestrian was engrossed in an audiobook with a great story.  What he may have thought he was gaining by listening to the audiobook he was losing by not paying attention to the world around him.

Yogi

One of the late Yogi Berra’s attributed quotes was “You can observe a lot just by watching.”  Famed investor Peter Lynch, who ran the Fidelity Magellan mutual fund for many years and who went on to author many books, used Yogi’s maxim to find new investment ideas.  Lynch would go to the shopping mall to find which stores were crowded and then perhaps invest with them.  In his book, “One Up on Wall Street”, Lynch discusses how you should “invest in what you know about” and that you should acquire “local knowledge”.  The only way to acquire “local knowledge” is if you observe things and truly understand them without having earphones in your ears.

IMO

There is nothing wrong with listening to your earphones.  You can certainly learn a lot by listening to a good audiobook or to an informative podcast.  My point is that you should do one thing at a time.  Listen to that book or podcast while you are sitting at home or on an airplane, for instance.  Don’t listen while walking on a crowded sidewalk and thereby make yourself a danger to others.  Be open to the phenomena around you.  You never know when you might come up with your next great investment idea.  The human brain works in strange ways – let it do its work!

Call Me Skeptical

Tariffs

Put me down as skeptical that this whole Tariff/Trade War narrative will blossom as the media fears that it will.  I believe the Trump administration is using tariffs as a way to negotiate and to extract other concessions from various trade partners.  Let’s take China, for instance.  Talk with any business person who does business with or has a manufacturing plant in China, and they will tell you that theft of intellectual property is a big issue.  Take golf clubs, for instance.  Most of the major golf club companies manufacture in China.  Why is it that you can go to a major golf retailer and find knock-off brands that look exactly like the major brands but cost much less?  Because Chinese manufacturers take the clubhead mold, copy it, and go down the street and set up shop on their own using the copied mold.  There are similar stories out there in a number of different industries.  The Trump administration states they are acting with tariffs in an effort to end intellectual property theft.

I hate tariffs because they harm the general public in an effort to protect a small segment of the economy.  Steelworkers may enjoy steel tariffs but the general population won’t enjoy paying more for their cars.  All that said, you can’t argue with the administration’s position that intellectual property theft is a problem.  I would argue that there may be better ways to affect intellectual property theft.  However, whatever has been tried to date has not been fully successful.  I am skeptical that the threat of tariffs will be any more successful than has any other method of negotiating with people who steal intellectual property.

Stay in the USA

I think another part of the tariff threat is to encourage US manufacturers to remain in the US.  This, in addition to Trump outright shaming companies who consider moving out of the US, such as he recently did with Harley-Davidson.  Maybe the thought that a company’s goods would be hit with a tariff once they are imported back into the US will be enough to make the company choose to remain in the US.  Seems far-fetched but maybe.

Unanimity

There is near unanimity in the financial press that tariffs are bad.  This is another reason why I am skeptical that the tariff threat will amount to much.  President Trump loves to tweak the press.  He will do things just to spite the press, but I don’t think he will actually act to harm the US economy.

Re-Election

Another reason given out there is that Trump is floating tariffs in order to prop up his electoral base prior to the 2020 Presidential Election.  This seems far-fetched to me because I am not reading about a groundswell of support for these tariff threats.

IMO

While I concede there will be some targeted tariffs implemented, I don’t think tariffs will be widespread and I think the negative press about tariffs will far outweigh the actual tariffs.  I believe tariffs will eventually put on the back burner as an issue when some other issue arises to take its place.  As for your investments, hold your course, and maybe look for any correction caused by new tariff threats as an opportunity to add to your positions.


Emerging Markets

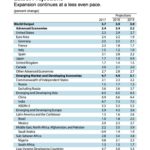
Several other bloggers/columnists that I follow have pointed this out so I will as well.  The International Monetary Fund (IMF) just issued its projected growth report for various world economies.  Here it is:

I know, it is hard to read.  Here is a link to the report, which is Table 1 on the IMF Website:  https://www.imf.org/en/Publications/WEO/Issues/2018/07/02/world-economic-outlook-update-july-2018

Good News

There is a lot of good news in the report.  The IMF projects worldwide economic growth to be 3.9% in both 2018 and 2019.  That’s a significant growth rate!  Emerging economies are projected to grow in the 5%-range for the next two years and Advanced economies in the low-2% range.  There are zero regions in which the IMF projects there will be negative growth for the next 2 years.  That is very good news for world economies!

Emerging Markets

What constitutes an Emerging Market for the IMF?  The two largest are China and India, the two most populous countries on earth.  Together, they represent most of the projected growth:  Mid-6’s for China and mid-7’s for India.  Pretty much every country except for the US, Western Europe, Canada, and Japan are Emerging Markets.  Russia is the laggard among Emerging Markets, with growth there projected at only 1.5%.  I see no downside to economic growth in Emerging markets.  Growth means more people will become employed, which means more tax revenues to the respective governments, which means more services to their populations.  Capitalism at its best.

Bad News

From an investor’s perspective, the bad news (if you want to call it that) is that the US economy is among the strongest in the Advanced world.  Because the US economy is stronger, our interest rates are going up faster than those in other Advanced Economies.  Higher US interest rates mean that the US Dollar will strengthen and other currencies will weaken, in relative terms.  For countries, especially Emerging countries, who need US Dollars to pay for goods such as petroleum products, the stronger US Dollar means those goods they need become more expensive, which may hinder their growth.  Thus, it is not as simple as looking at these IMF projections and conclude that you should buy Emerging Market equities because their growth will be greater.  The changes in currency values will be a check on the economic growth.  Will the US Dollar strengthen so much that it will overshoot the growth in Emerging Markets, and therefore cause Emerging Market stocks and ETF’s to depreciate in Dollar-denominated value despite their greater growth?  That is what we investment managers use our crystal balls for.

IMO

I think the US Dollar will not increase substantially more from where it is now because other economies and central banks will also raise interest rates as their economies grow faster.  Therefore I think it is wise to at least have exposure to if not overweight Emerging Market stocks through ETF’s such as iShares EEM.  Having international exposure is always a good idea and the high growth rate just projected by the IMF is another reason why you should not have all of your eggs in the basket of US markets.

Netflix

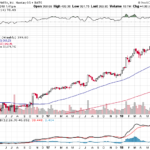
Wow!  What an amazing run for Netflix stock (NFLX)!  It has risen from $192 to $400 YTD this year alone, which is a more than 100% increase.  That ain’t bad, as Yogi would have said.  As the below Weekly chart shows, NFLX was in the low-$100 range or below that during most of 2016, then began its upward run during the Fall of 2016, just before you-know-who was elected President.  NFLX hasn’t looked back since.  NFLX is so high now that 2 analysts (Buckingham and UBS)  have downgraded NFLX just because they believe NFLX has met its price target already and now may be priced too high.

Original Content

The impetus for NFLX’s run upward has been its original content.  Quality original content is what drives subscriber growth.  Netflix’s original content has been very good.  Emmy Award nominations were just announced and Netflix had the most of any network with 112 nominations, ahead of HBO’s 108.  This speaks to the high quality of Netflix’s content.  Subscribers will pay the $11/month if they are getting good value in return, and they are, so far.  This article posted on Investopedia says that Netflix will spend $13 Billion on original content in 2018, more than the $8 Billion Netflix had targeted at the beginning of 2018.  That’s what happens when your stock price doubles.  The Investopedia article also states that the average Netflix subscriber streams 90 minutes of original content per day and that Netflix streaming accounts for 1/3 of all internet traffic.  Think about that!  There must be subscribers out there who do nothing but sit there all day and stream Netflix, to bring the average up, because I don’t come close to streaming 90 minutes per day.

Will the quality original content continue to result in subscriber growth?  Many who follow the subject believe Netflix’s best opportunity for subscriber growth is outside the USA.  If so, Netflix will eventually hit roadblocks via regulatory (China) and affordability (India) issues.

Earnings

Update:  Netflix’s 2nd Quarter earnings were released and revealed that Netflix’s subscriber base grew by “only” 5 million vs. 6 million forecast for the quarter.  The stock is down about 13% to about $347, meaning NFLX hasn’t doubled in 2018 after all.  That’s a big hit in the stock but it means the stock is only up 75% this year instead of 109%.  Still pretty good.  Let’s see how it runs from here.

IMO

I am skeptical that Netflix can continue its string of success in producing high-quality programming content at a relatively low and contained cost.  Netflix’s formula has worked so far, but this being Hollywood and the entertainment industry, there is likely to be a point at which either Netflix produces a dud or a string of duds, and/or stars will want to be paid more to do jobs for Netflix.  In a way, Netflix has been the New England Patriots of the entertainment industry:  getting good value work from previously-unknown players/actors, but then jettisoning them when they have problems (Kevin Spacey) or grow too big for their britches.  Every other Hollywood studio throughout history has eventually fallen victim to hubris.  Will Netflix be the first not to fall victim as such?  I doubt it, but that doesn’t mean Netflix will implode when it hits an inevitable rough patch.  I just believe that its rate of growth will slow down, which will disappoint Wall Street analysts, which will spark turbulence for NFLX stock.  I also believe that there will be increased competition for the streaming eyeballs.  Amazon Prime is a player and I believe there will be others.   With 5G connectivity on the horizon, we will see what new technologies that will spur and what companies will be there to take advantage of the new technologies.  I believe Netflix is a great service, but not one that will conquer the world.  I wouldn’t short it, but I wouldn’t go all in with it as an individual stock play.  I own NFLX through my QQQ and other ETF’s and I believe that’s the best way to play NFLX while remaining diversified.

Opening Day At Saratoga Race Track

Opening Day

Today is Opening Day at Saratoga Race Track, one of my favorite places to go.  I am reposting this from the same day a year ago because it discusses why I enjoy horse racing and why horse racing is different than investing.

One of my favorite hobbies is horse racing.  The Sport of Kings.  So-called because only a King can afford to own racehorses.  I do not own racehorses.  My interest is in watching them race and placing my bets to see if I can predict which one will win.  Our daughter rode Equestrian when she was in school, and we owned a horse and then leased a horse for her.  Owning an Equestrian horse is without a doubt a money-losing proposition.

Similarities

Horse racing and Investing are similar but not the same.  They are similar because the racing fan can get the Daily Racing Form (similar to an investor’s Value Line or Morningstar report or even a company’s financial statements) and analyze the data therein.  The better determines which horse they think will win or be in the money (like an Analyst who labels a stock Buy, Hold or Sell after their review), and then watches the race play out (like those of us who watch the stock ticker or look at our monthly brokerage statements).  They are similar because money management is of paramount importance.  One of the best books on money management in any capacity is “My $50,000 Year At the Races” by Andrew Beyer.  In the book, Beyer discusses how he went from his Ivy League education to trying to make enough money to live on by gambling at the horse races.  It was the late 1970’s and $50,000 was enough money then.  He bided his time until he felt the odds were in his favor and then wagered big.  At the end of that year, he calculated he made the bulk of his $50,000 in only about a handful of races.  A great lesson for investment managers as well:  Bide your time and stay in the game until you see a great opportunity, whereupon you Bet The House.   Beyer became a newspaper columnist and also developed a system of normalizing past performances by horses and come up with a Speed Rating number that today is a standard that is provided for every horse for every race in the Daily Racing Form.  That book is called “Beyer On Speed”.  If you haven’t yet figured it out, I love reading the Daily Racing Form.  Past performances, fractions, pithy descriptions of what each horse did in each race, jockey/trainer profitability based on $2 bet each time this jockey rode a horse trained by this trainer – the Daily Racing Form has it all.  I so wish there was something equivalent in the Investing world, where all the information an investor wants is in one newspaper.  

Hedging

Horse Racing and Investing are similar also because, different than other forms of gambling, in horse racing the bettor can hedge and diversify.  Let’s say there are 10 horses in the field, and you think after reading the Daily Racing Form that 3 of the 10 are clearly better than the other 7.  However, you can’t tell which of the 3 will win.  There are some simple ways to address this.  One is to “box” the three horses in an Exacta.  Then, if 2 of your 3 horses run 1st and 2nd, then you win.  It costs more for an Exacta, but then again Investing hedges also cost more than a pure play investment.

Another way to hedge in horse racing is to bet to Place (2nd place in the race) or Show (3rd place in the race).  The payoffs are smaller, but a bettor can still make money through Place and Show bets.  Sometimes, Exacta and Place and Show bets are the difference between winning and losing at the Track.  

What would an Exacta Box in Investing look like?  Let’s take the 3D Printing industry as an example.  You determine that the 3D Printing industry is likely to have exponential growth, but you don’t know what specific companies will come out on top.  You think 3D Systems, Stratasys and Protolabs are most likely to succeed, so you invest in all three equally.  Then see how it plays out.  In doing so, you have invested in the 3D Printing industry, not necessarily just one company, because you think these 3 will clearly be the winners.  This strategy should outperform a 3D Printing ETF, because you have not invested in non-winning companies.  What if a new player enters the 3D Printing market?  You can adjust your bet – there is not an “ending” to the 3D Printing industry.  

This “Exacta” strategy makes a lot of sense in a lot of emerging industries.  In many new industries, 2 or 3 companies usually emerge as the market leaders over time.  Think Coke and Pepsi, McDonald’s and BK, or Boeing and Airbus.  

Winners

Other industries, though, are different, with one giant market leader.  Google has destroyed all rivals in web search.  Microsoft owns the operating systems business.  Apple is top of the heap in smartphones.  Facebook seems to be the Social Media leader.  Amazon wins hands down in retail.  Netflix?  I’m a skeptic.  These are the FANG stocks (FAANGM?).  These were all Win bets.  They are all Secretariat in the 1973 Belmont Stakes (YouTube it if you don’t know it).  Win bets always pay the most.  What do you think is the next Win bet?  

Differences

Investing is different than horse racing because, in horse racing, results and payoffs are binary, and horse racing odds are stacked against the bettor and in favor of the House.  The race is run, and you either win or lose your bet.  The race is over.  In investing, it is never over, and you can always adjust your investment allocations.  

Horse racing odds are not in the bettor’s favor.  The odds on the racing tote board are Odds Against that horse winning the race.  The Odds can easily be converted to a Probability, as follows:  

Second Number listed in the odds divided by Sum of Both Numbers listed in the odds

So, let’s say a horse is listed as 5:1.  That means bettors think there is a ⅙ probability that horse will win (1 divided by 5+1 or 6).  ⅙ means a 16.7% probability (or possibility) of that horse winning.

How are the odds stacked against the bettor?  Take the odds for all the horses in the race, convert them to a percentage possibility using the math above, and then add up all of the percentage possibilities for all of the horses.  They will add up to more than 100% – usually between 120% and 150%.  That means that, collectively, the horses are overvalued, and that their odds against winning are understated.  

IMO

Horse racing is for fun, for my own entertainment.  Investing in the market is serious business, even though it is still fun for me.  I only bet up to $20 in one race, usually much less.  I take much larger positions in the market.  They are not the same thing.  It is interesting to transpose the terminology from one activity to the other.  Think about how you are approaching them each within a theoretical framework.  Smart money management is key to both activities.  So is discipline – don’t bet or invest without first having done your homework, and then don’t do your homework and not wager or invest accordingly.  Have a methodology and stick to it.  

Wages Are Increasing

The US Government Bureau of Labor Statistics (BLS) released its June 2018 report on employment and wages last week.  Among other things, it showed that wages increased at a faster pace than they have in several years.  Overall, non-farm wages increased 2.7% year over year in June, which is faster than several years in the 1’s and low 2’s.  However, wages increased in some industries faster than they did in others.

Here is a link to the BLS table that shows the raw data.  Here is a link to an Excel spreadsheet that I created using the BLS data that shows the percentage increase by labor sector:

blswages0618b

My Excel spreadsheet shows that the wage increases were labor sector-dependent.  Wages in the Financial sector were up 4.63% and wages in the Leisure and Hospitality sector (Vegas, Baby!) were up 3.37%.  However, if you work in Non-Durable Goods Manufacturing, your wages rose only 1.19%.  It is not unusual for wages to rise at different rates in different sectors of the labor market.  The news is that the average increase of 2.7% is higher than it has been in several years.

Rise in Prices?

It’s one thing if wages are rising.  It’s another thing if companies raise their prices to customers in order to offset the rise in wages.  According to this Wall Street Journal article, as with the rise in wages, the ability of companies and industry sectors to raise prices varies from sector to sector.  The article says discount retailers and fast food restaurants have not yet been able to raise prices to offset the increase in wages.  The Leisure and Hospitality sector has been particularly squeezed:  it has not yet been able to recoup that 3.37% increase in wages.  Prices for your hotel room may be heading up in the future, but the data shows that they haven’t yet.

Another Part of the Story

The Industrial sector, including all goods-producing sectors, actually had some of the lowest wage growth.  However, the Industrial sector has other headwinds, including higher raw materials costs which are starting to be exacerbated by higher tariffs.  Industrial companies are having a hard time raising wages while remaining profitable because their materials costs are increasing.  So much for the Deflation theory.  Something has to give, and I believe Industrials will have to raise retail prices, which will stoke overall inflation.

IMO

This whole scenario is why we are seeing higher interest rates (at least on the short end of the curve) and more stock market volatility.  The labor market remains tight with no sign of loosening.  Unemployment ticked up to 4.0% but that is still low.  Former “non-participants” in the labor force are deciding now to participate (at least at the margins) because of the higher wages.  I believe longer-term bonds (10 years and over) are over-bought currently, meaning that I believe their interest rates are too low and will have to rise.  I believe core inflation will start to match the wage growth, in the mid-2% range.  All of this is not the end of the world, and could actually be healthier for workers seeking higher wages.  However, the stock market may not like it in the short term and so we will have more volatility ahead.

Stuck In a Cave

The world is riveted to the story of the Thai youth soccer team and their coach who got stuck in a cave in Thailand.  It is an international rescue operation, which is something for humanity to be proud of, regardless of the outcome, which has turned out to be positive.

Don’t Go In There

Most people recognize that the mistake was to have gone into the cave in the first place.  This group went all-in on an adventure wherein there was only one exit and its door was closing quickly.  There may have been upside to exploring this particular cave, especially to pre-teen and teenage boys, but the upside could not have been commensurate with the downside, which was the possibility of losing their lives.  Of course, this lapse in logic is not atypical when it comes to teenage boys.

Lessons for Investing

Perhaps I am drawing an obtuse connection here, but I think there is a lesson here for investors.  The lesson is:  Don’t enter an investment where there the risk/reward ratio is asynchronous:  limited upside but unlimited downside risk.  And, if you do so, please don’t go All-In!  You could lose everything!  Always leave yourself a plausible exit strategy.  Realize that if you potentially could lose everything in an investment, make sure it is only a small amount that you can afford to lose.

Casino Analogy

Imagine a casino in a Communist country, and you decide to play Roulette there.  You decide to put all of your money on Number 4.  If you lose, you lose everything.  If you win, that’s great, but the Communist government takes 90% of your winnings.  That is effectively what this Thai soccer team did:  They entered a situation where the risk/reward ratio didn’t make any sense.

Investing Analogy

Most publicly-traded stocks have some market, so you can usually get out of a stock, even if it is for pennies on the dollar.  The same thing for real estate – there is value in the land if nothing else, and the owner can usually sell it for some value.  The closest examples to the Thai Cave are probably some type of private limited partnership, such as an individual oil well that is a dry hole, or an annuity or another insurance vehicle where the insurer is poorly-rated and ultimately goes bankrupt.  In these situations, it is very difficult to sell your interest once you buy it.  However, there is upside to both, and so these are imperfect analogies but you probably get the point.

IMO

This being 2018, and with the world’s media focused on these unfortunate Thais, now that they have been saved, it is likely that their story will be sold for big bucks, and their upside to them will have been monetized.  That was probably not their intent when they entered the cave, but things could work out that way.  Another upside to the story, as I mentioned above, and also not the intent of the cave explorers has been the sense worldwide that everyone is pulling for them and hoping for their rescue, even for the poor coach who led them into the cave in the first place.  Beware of caves when you invest your money!